Board Game Scatterplot
A React-based scatterplot visualization for board game data using D3.js. This project is designed to be hosted on vizub and uses CDN imports for easy deployment.
Features
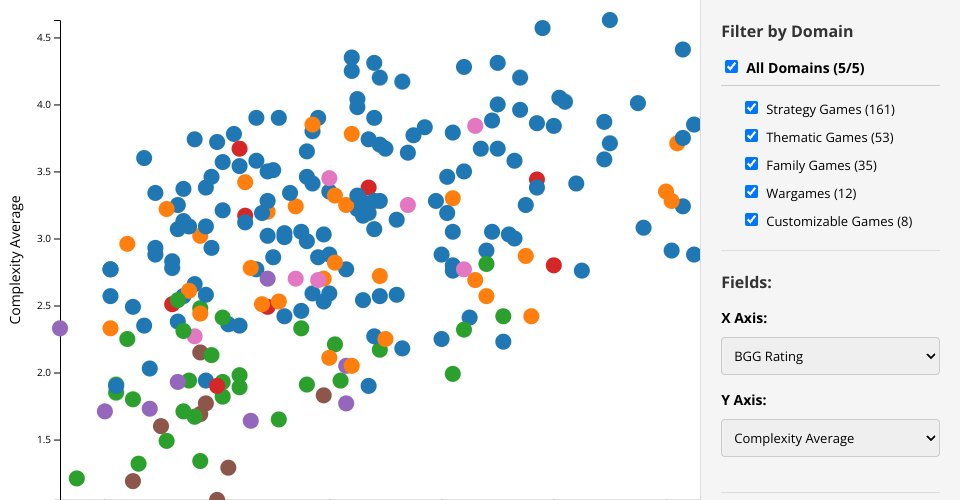
- Interactive scatterplot showing board game data
- X-axis: BGG Rank (BoardGameGeek ranking)
- Y-axis: Complexity Average
- Domain and mechanics filtering with hover effects
- Responsive design with proper margins and labels
Getting Started
Local Development
Simply open index.html in a modern web browser that supports ES modules. No build process or package manager required!
Hosting on vizub
- Upload all files to vizub
- The visualization will work immediately using CDN imports
Project Structure
App.js- Main React component containing the scatterplot logicviz.js- D3.js visualization functionsaxis.js- Axis rendering functionsaxisLabels.js- Axis label rendering functionsdata.csv- Board game datasetindex.html- HTML entry point with import mapsindex.js- JavaScript entry point
Interactive Features
- Domain Filtering: Filter games by category (Strategy, Thematic, Family, etc.)
- Mechanics Filtering: Filter games by mechanics (Hand Management, Dice Rolling, etc.)
- Hover Effects: Hover over checkboxes to highlight related points in green
- "All" Toggles: Quick select/deselect all domains or mechanics
- Bidirectional Filtering: Works with domains OR mechanics as primary filter
- Visual Highlighting: Green points appear on top when hovering
Data
The visualization uses board game data from BoardGameGeek, including:
- BGG Rank (rating-based ranking)
- Complexity Average (game complexity rating)
- Game domains (Strategy, Thematic, Family, etc.)
- Game mechanics (Hand Management, Dice Rolling, etc.)
Technologies Used
- React 19 (via CDN)
- D3.js 7 (via CDN)
- ES Modules
- Import Maps for CDN dependencies
Data Source
This dataset contains data collected on board games from the BoardGameGeek (BGG) website in February 2021. The plot shows the top 250 ranked games with their BGG rank vs average complexity rating.
MIT Licensed