Resources
Contact
Pricing
🇺🇸
EN
Log in
Open Editor
Revision History
Export Image
Share
dv2020-ep26-viz26 - line graph (step one)
1
Fork
0
Likes
zach b.
0 views in last 90 days
Last edited Mar 17, 2023
Created on Mar 17, 2023
Forked from
dv2020-ep25-viz25 - scatter plot
uses
v2 runtime
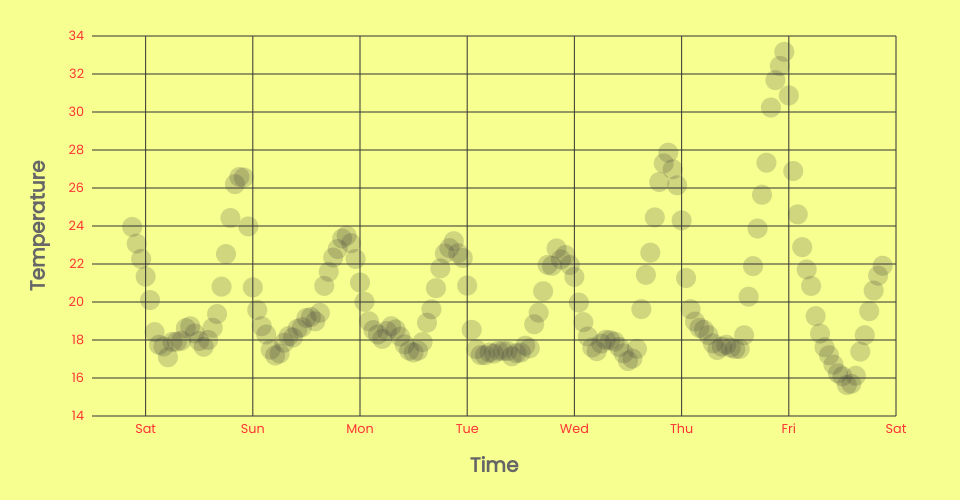
line graph of san fran temps over time.
Data Canvas Sense Your City Dataset
Episode 26
MIT Licensed