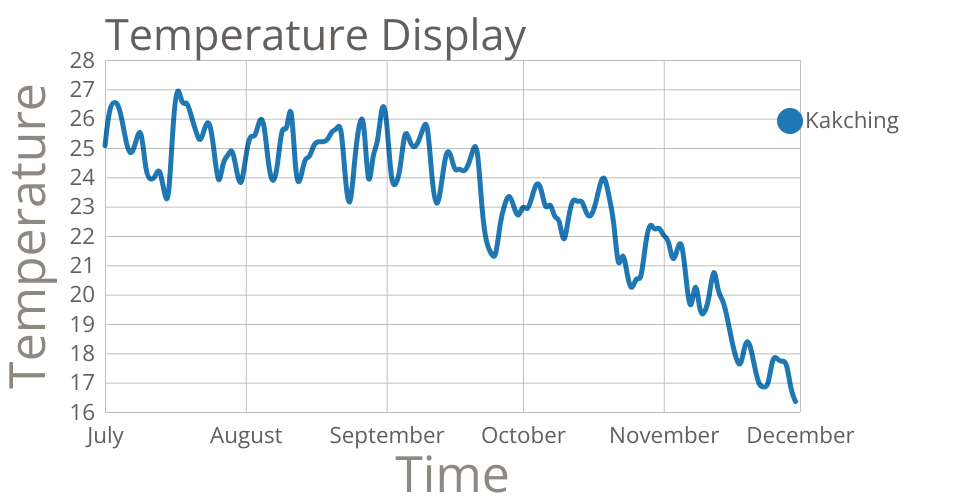
This line chart shows one week of temperature (in degrees Celcius) in cities around the world. The data comes from Data Canvas - Sense Your City.
https://raw.githubusercontent.com/ask4jm/Test/master/data.csv
MIT Licensed
This line chart shows one week of temperature (in degrees Celcius) in cities around the world. The data comes from Data Canvas - Sense Your City.
https://raw.githubusercontent.com/ask4jm/Test/master/data.csv