Export Image
Export Code

Economic Freedom Index Radar Chart-China vs US

hotdoujiang

Sunday, June 22, 2025: 0 viewsMonday, June 23, 2025: 0 viewsTuesday, June 24, 2025: 0 viewsWednesday, June 25, 2025: 0 viewsThursday, June 26, 2025: 0 viewsFriday, June 27, 2025: 0 viewsSaturday, June 28, 2025: 0 viewsSunday, June 29, 2025: 0 viewsMonday, June 30, 2025: 0 viewsTuesday, July 1, 2025: 0 viewsWednesday, July 2, 2025: 0 viewsThursday, July 3, 2025: 0 viewsFriday, July 4, 2025: 0 viewsSaturday, July 5, 2025: 0 viewsSunday, July 6, 2025: 0 viewsMonday, July 7, 2025: 0 viewsTuesday, July 8, 2025: 0 viewsWednesday, July 9, 2025: 0 viewsThursday, July 10, 2025: 0 viewsFriday, July 11, 2025: 0 viewsSaturday, July 12, 2025: 0 viewsSunday, July 13, 2025: 0 viewsMonday, July 14, 2025: 0 viewsTuesday, July 15, 2025: 0 viewsWednesday, July 16, 2025: 0 viewsThursday, July 17, 2025: 0 viewsFriday, July 18, 2025: 0 viewsSaturday, July 19, 2025: 0 viewsSunday, July 20, 2025: 0 viewsMonday, July 21, 2025: 0 viewsTuesday, July 22, 2025: 0 viewsWednesday, July 23, 2025: 0 viewsThursday, July 24, 2025: 0 viewsFriday, July 25, 2025: 0 viewsSaturday, July 26, 2025: 0 viewsSunday, July 27, 2025: 0 viewsMonday, July 28, 2025: 0 viewsTuesday, July 29, 2025: 0 viewsWednesday, July 30, 2025: 0 viewsThursday, July 31, 2025: 0 viewsFriday, August 1, 2025: 0 viewsSaturday, August 2, 2025: 0 viewsSunday, August 3, 2025: 0 viewsMonday, August 4, 2025: 1 viewTuesday, August 5, 2025: 0 viewsWednesday, August 6, 2025: 0 viewsThursday, August 7, 2025: 0 viewsFriday, August 8, 2025: 0 viewsSaturday, August 9, 2025: 0 viewsSunday, August 10, 2025: 0 viewsMonday, August 11, 2025: 0 viewsTuesday, August 12, 2025: 0 viewsWednesday, August 13, 2025: 0 viewsThursday, August 14, 2025: 0 viewsFriday, August 15, 2025: 0 viewsSaturday, August 16, 2025: 0 viewsSunday, August 17, 2025: 0 viewsMonday, August 18, 2025: 0 viewsTuesday, August 19, 2025: 0 viewsWednesday, August 20, 2025: 0 viewsThursday, August 21, 2025: 0 viewsFriday, August 22, 2025: 0 viewsSaturday, August 23, 2025: 0 viewsSunday, August 24, 2025: 0 viewsMonday, August 25, 2025: 0 viewsTuesday, August 26, 2025: 0 viewsWednesday, August 27, 2025: 0 viewsThursday, August 28, 2025: 0 viewsFriday, August 29, 2025: 0 viewsSaturday, August 30, 2025: 0 viewsSunday, August 31, 2025: 1 viewMonday, September 1, 2025: 0 viewsTuesday, September 2, 2025: 0 viewsWednesday, September 3, 2025: 0 viewsThursday, September 4, 2025: 0 viewsFriday, September 5, 2025: 0 viewsSaturday, September 6, 2025: 0 viewsSunday, September 7, 2025: 0 viewsMonday, September 8, 2025: 0 viewsTuesday, September 9, 2025: 0 viewsWednesday, September 10, 2025: 0 viewsThursday, September 11, 2025: 0 viewsFriday, September 12, 2025: 0 viewsSaturday, September 13, 2025: 0 viewsSunday, September 14, 2025: 0 viewsMonday, September 15, 2025: 0 viewsTuesday, September 16, 2025: 0 viewsWednesday, September 17, 2025: 0 viewsThursday, September 18, 2025: 0 views
14 views in last 90 days
Last edited Sep 26, 2019
Created on Sep 19, 2019

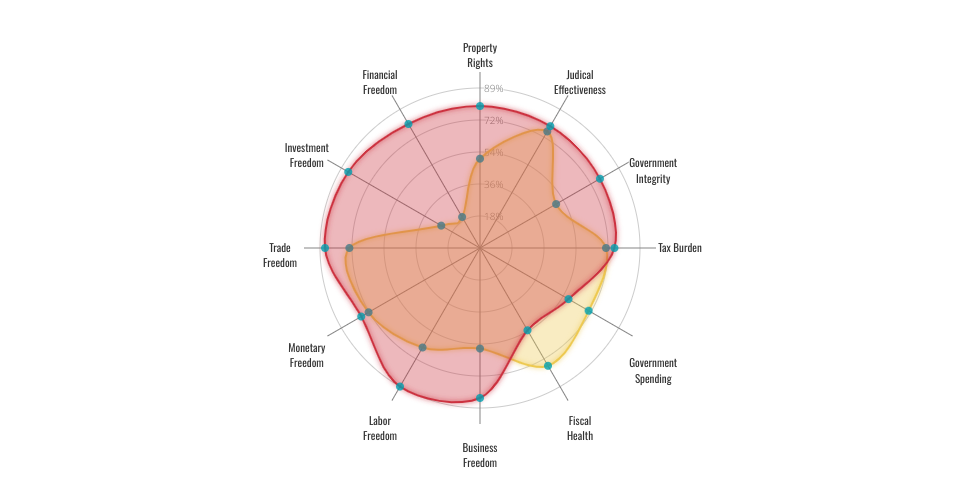
This is a gorgeous radar chart designed by Nadieh Bremer. So far I am doing well on integrating it with my World Economic Freedom Index dataset, although some further changes are still necessary for better interpreting. You can see from the chart that the data indicates that the economic of the United States is generally more free than the economic of China, except for the two aspects, Fiscal Health and Government spending.
Here're my findings and future improvement ideas:

  • The radar chart is flexible with the number of axis. It is not fixed, so you can have as many axises as you like. Here I have 12 indexes describing the economic freedom. Hence, my radar chart is a 12-axis chart.
  • The function of the scale need to be changed according to need. The 'default' function is about the percentage.
  • The max value of the axis is not fixed too. It is depending on the data you entered in. Changes are needed if you want the fixed maximum value.
  • It is so frustrating that the data entry is by typed not imported from csv or json. I think that for the future improvements I can use d3 to import formated data instead of typing.
  • There's no tooltip by placing the mouse on the inner information, which means that you cannot tell whether the red is China or not unless checking the src. I think I can add a tooltip to the radar chart to make it better.
MIT Licensed