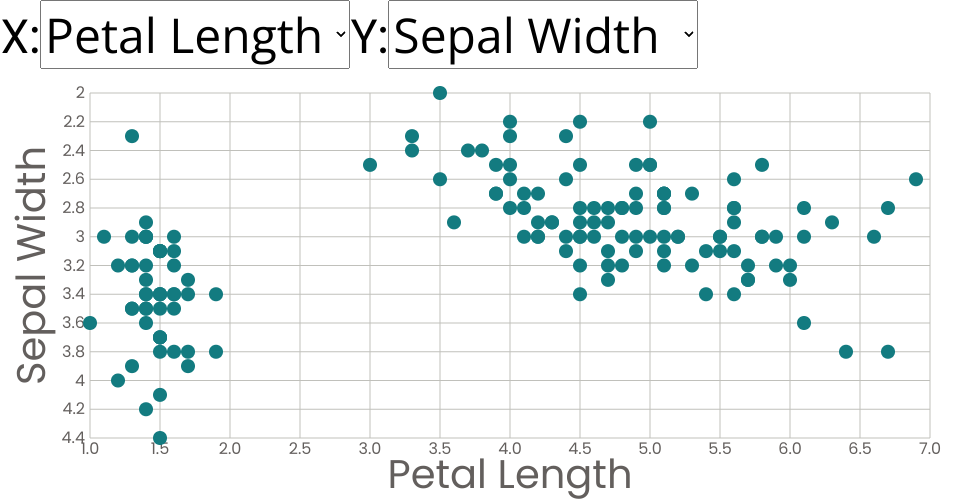
A scatter plot of The Iris Dataset.
Data visualization study following Curran.
add dropdown.js to the file which is the same as menus with react
create initial x attributes according to the data columns and add it to the usestate function
- note that the initial x attributes should be put before the if condition otherwise error occurs.
change the height of the webpage to fit the whole chart. Inspect the menu to see its height, then delete the height from the chart height to render more room for the menue.
Y is completely the same: copy the code creating menu for x for y
make the x axis label and y axis label updated by the selected value
- move the arributes constant to the front so that it can be used in the following step
- write getlabel function to get the label based on the selected value
- change the xaxislabel constant using the getlabel function
Improvements:
- visually not appealing
- select attributes not match with the expected scale, not work
MIT Licensed