Resources
Contact
Pricing
🇺🇸
EN
Log in
Open Editor
Revision History
Export Image
Share
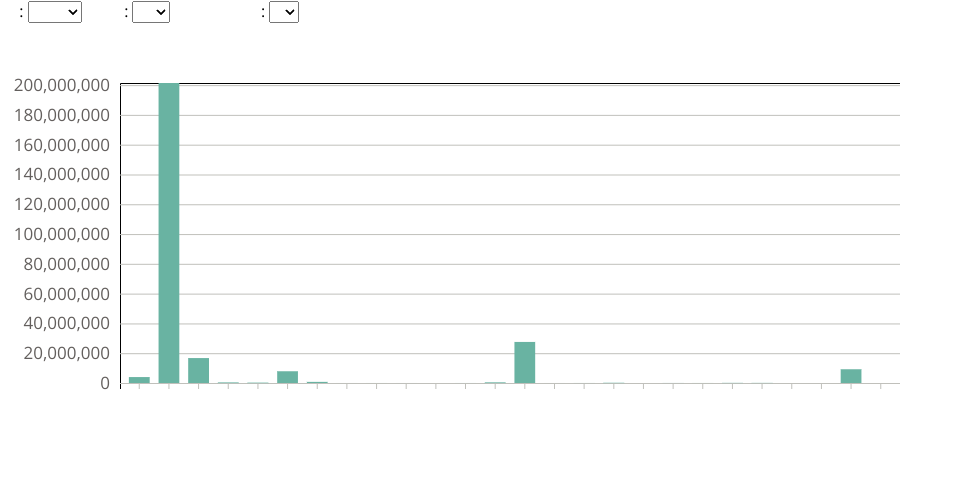
Bar chart of Port
0
Forks
0
Likes
henry8966
0 views in last 90 days
Last edited Jan 13, 2021
Created on Jan 12, 2021
Forked from
Cars Scatter Plot
uses
v1 runtime
This scatter plot shows data about cars, from
UCI Machine Learning Repository: Auto MPG Data Set
.
MIT Licensed