Scatter Plot Visualization
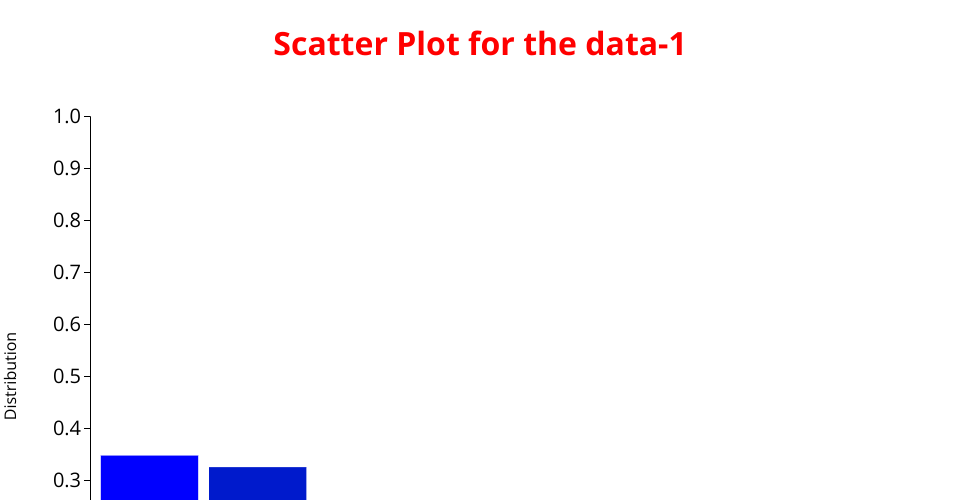
This project demonstrates how to create a scatter plot visualization using D3.js library. The scatter plot represents the distribution of genres across different rating ranges.
MIT Licensed
This project demonstrates how to create a scatter plot visualization using D3.js library. The scatter plot represents the distribution of genres across different rating ranges.