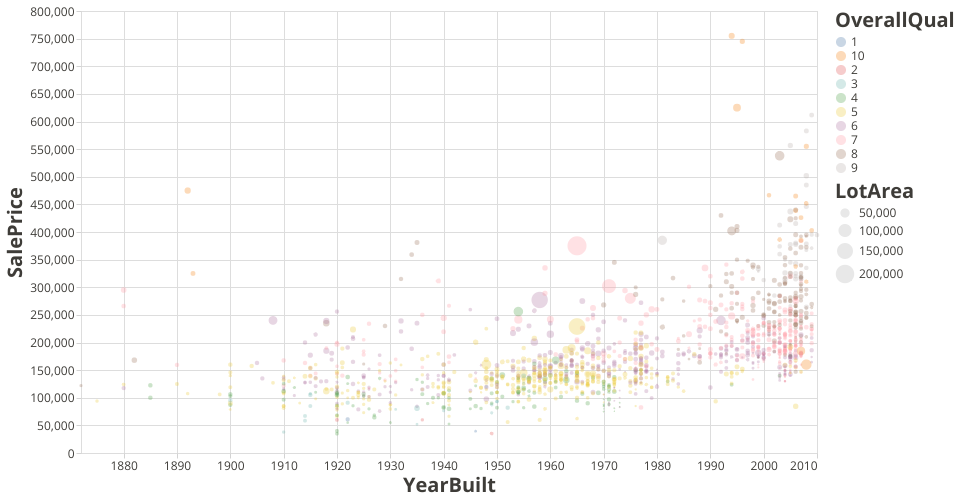
This visualization shows House Price in Ames, Iowa. Each circle represents a house price. It shows the difference in housing prices at different construction times and the distribution of overall quality and lot area and their impact on housing prices.
MIT Licensed