Resources
Contact
Pricing
🇺🇸
EN
Log in
Open Editor
Revision History
Export Image
Share
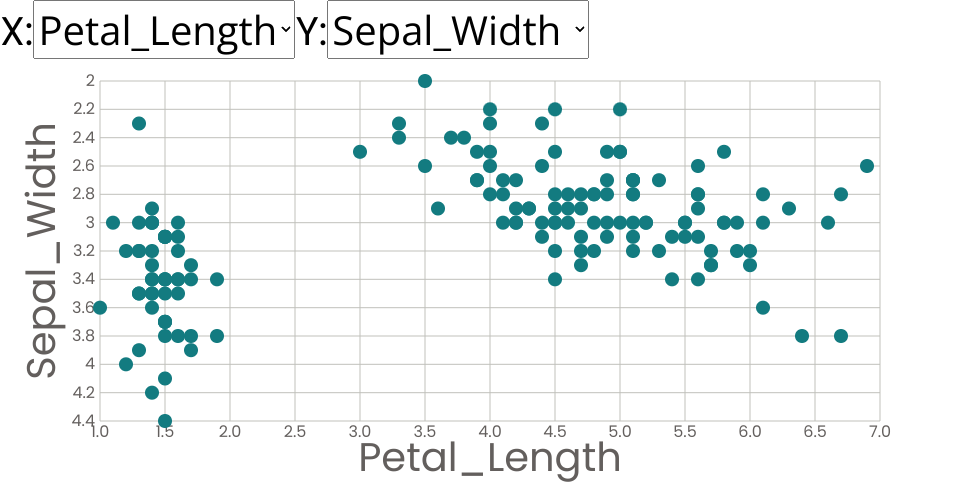
Scatter Plot with Menus
1
Fork
0
Likes
Joe Hutchins
0 views in last 90 days
Last edited Feb 23, 2022
Created on Feb 23, 2022
Forked from
Stylized Scatter Plot
uses
v2 runtime
A scatter plot of
The Iris Dataset
using D3 utilities, and uses React to render a Bar Chart
MIT Licensed