Resources
Contact
Pricing
🇺🇸
EN
Log in
Open Editor
Revision History
Export Image
Share
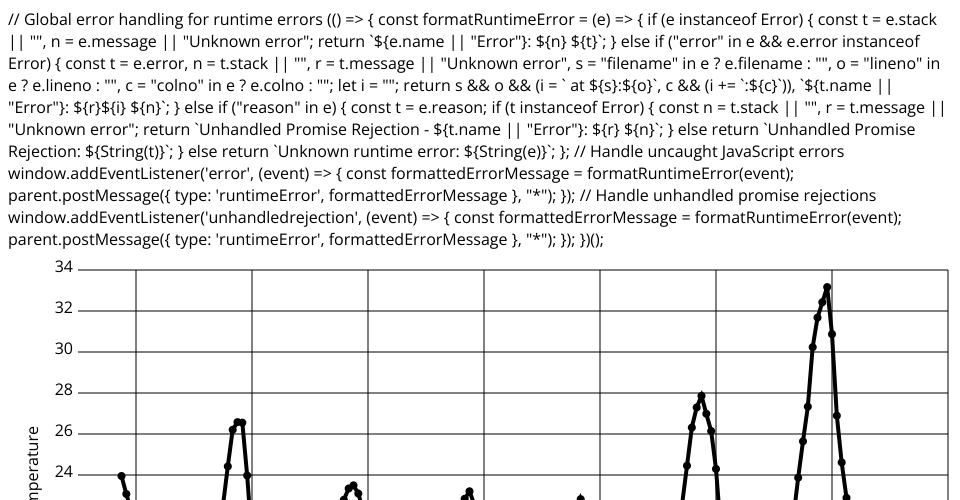
Line Chart Temperature vs Time Part - 2
1
Fork
0
Likes
goyalshivam204
0 views in last 90 days
Last edited Jun 20, 2023
Created on Jun 20, 2023
Forked from
Line Chart Temperature vs Time Part - 1
uses
v2 runtime
Loading and visualizing data about CSS named color using React and D3
MIT Licensed