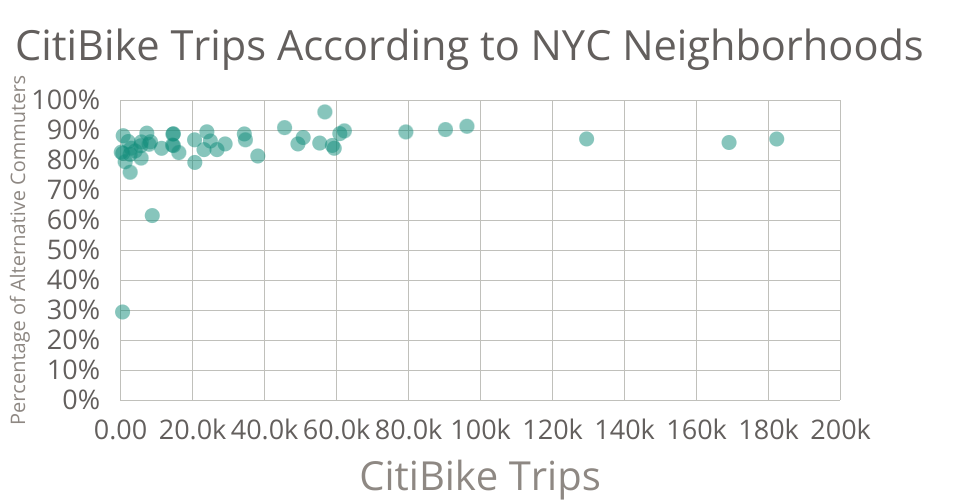
This scatter plot shows the number of CitiBike trips in a single month and percentage of workers who commute to work in some way other than driving alone. Each plot is representative of one neighborhood in New York City.
MIT Licensed
This scatter plot shows the number of CitiBike trips in a single month and percentage of workers who commute to work in some way other than driving alone. Each plot is representative of one neighborhood in New York City.