The last days I designed this page, with which I want to motivate myself to make different graphics from what I learned here => https://valentine-auer.at/datenjournalismus/weeklygraph/
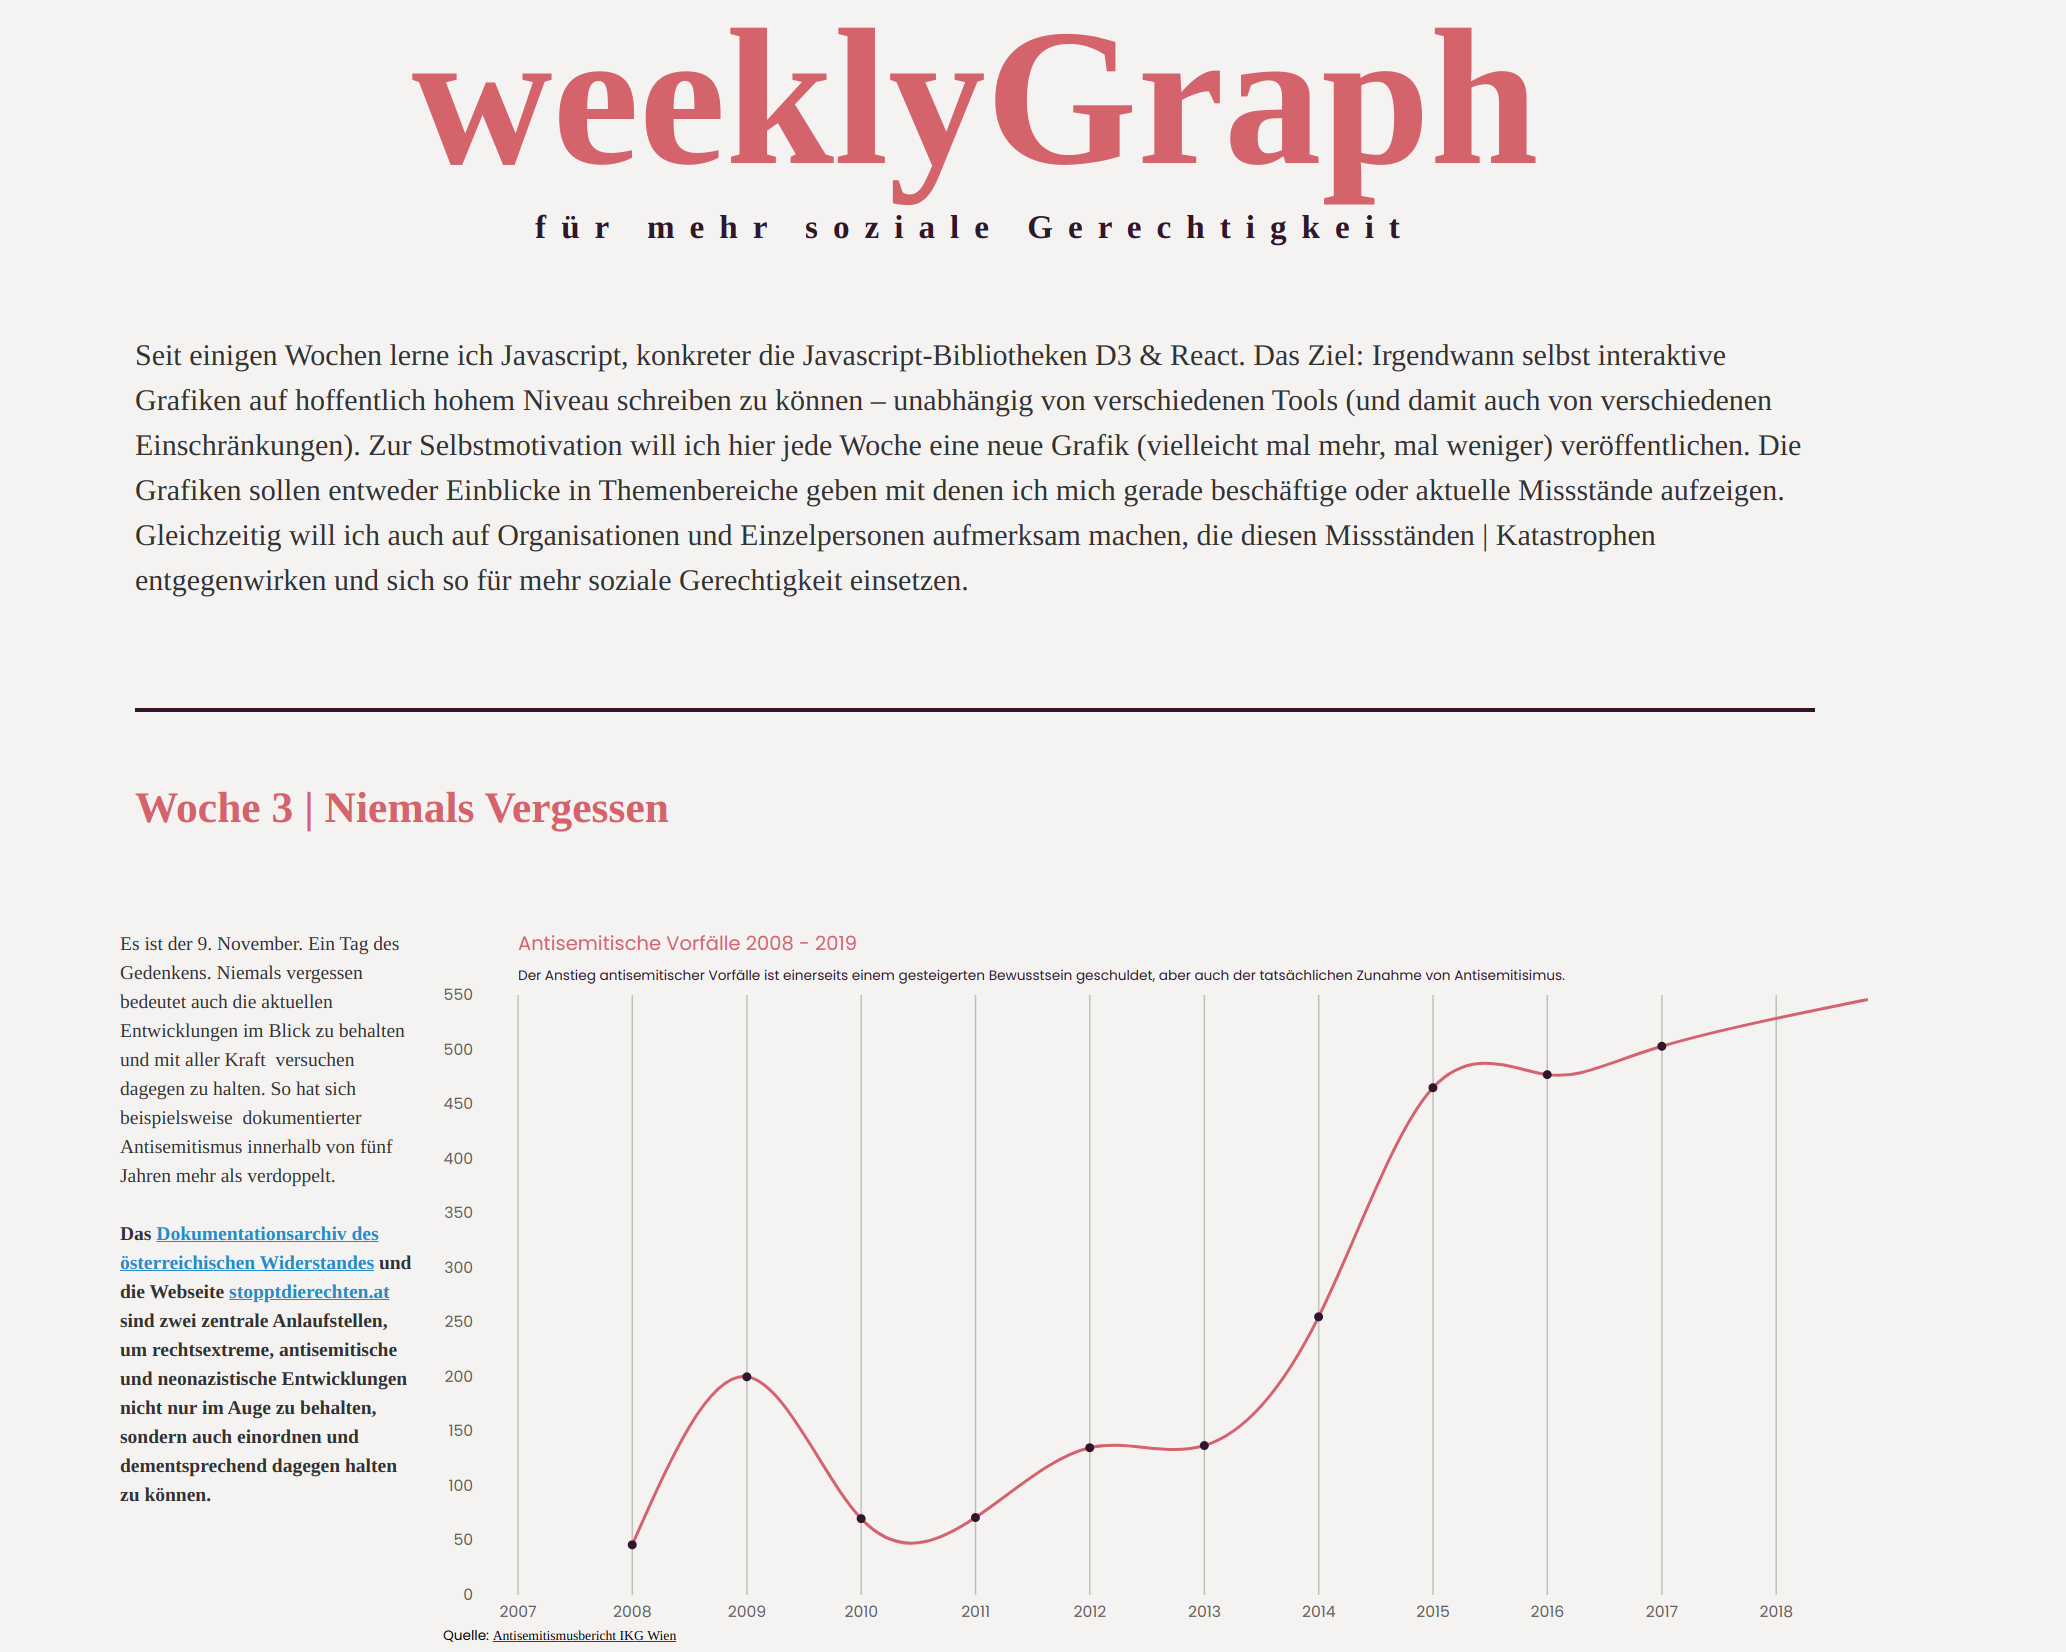
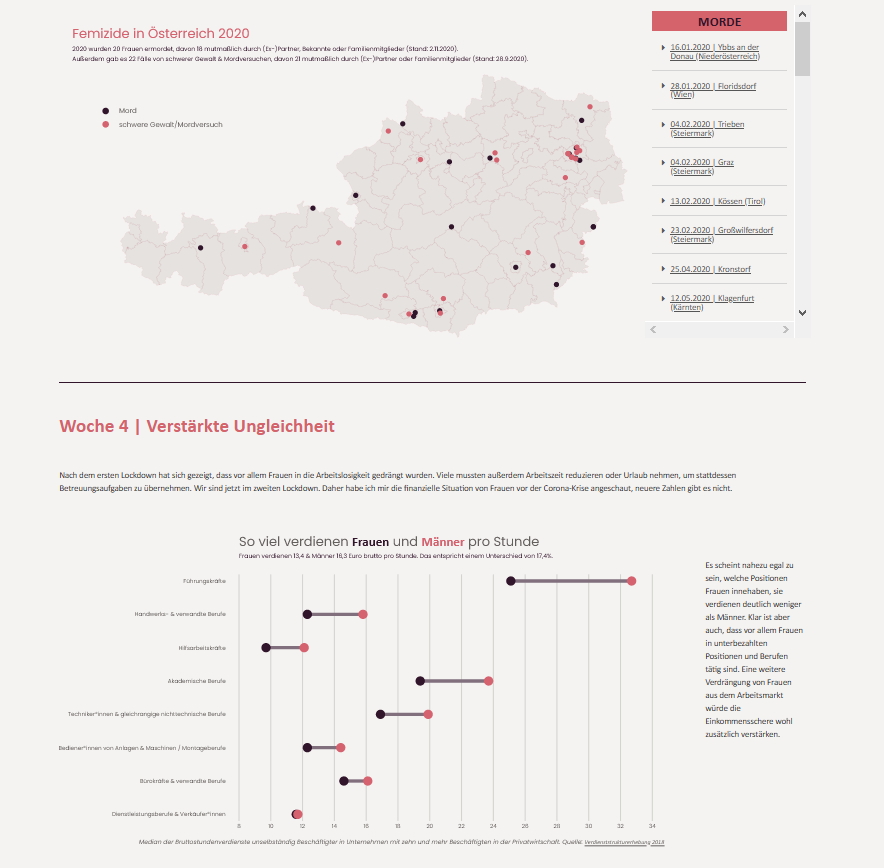
It’s called weeklyGraph (for social justice), because first of all I want to publish a graph every week and secondly these graphs should point out certain inequalities. At the same time I refer with each graph to NGOs that fight against these inequalities.
Unfortunately everything is in German, because my audience is from German speaking countries. Furthermore, I’m struggling to make everything responsive - so the graphics probably won’t be displayed correctly by all devices.
Nevertheless, I just wanted to show you how I put what I learned from the Datavis course into practice. It’s not much yet, but it will be filled week by week: )