Suggestion on organizing created visualizations

Hello, just a little idea.

As the number of created visualizations increases, I am feeling the growing need for organization.

I remember that there was a question about categorizing visualizations into directories or tags in the recent Vizhub survey, so I guess this issue is maybe already being dealt with.

But for a quick suggestion, what if the visualizations are sortable by title?

Right now, the possible options are the following:
image

If they are sortable by names, I can already organize them using the titles.
For example, I can group visualizations by chart types by naming them: Barchart - specific name , Barchart - another name… like so.

Also, personally, I find it more useful for the default sorting option to be “Most recent” instead of “Most popular”. I always start by changing the sort option.
I would like to hear opinions on this as well.

Thank you as always.

I would prefer to sort by naming them like Barchart. Once Barchart is chosen, it can be ordered by most upvoted or most forked to know which is working well that could be used for visualization.

These are great ideas! Thank you for the suggestion. Sorting by title could be a great intermediate step to introduce some level of organization.

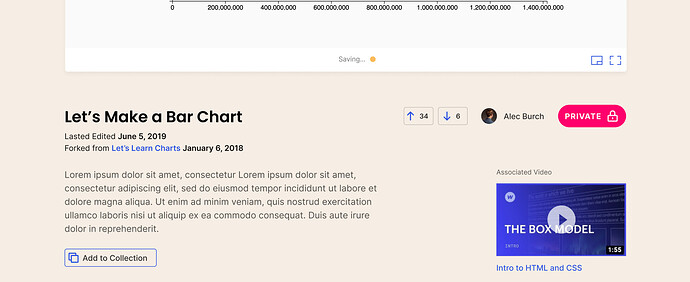
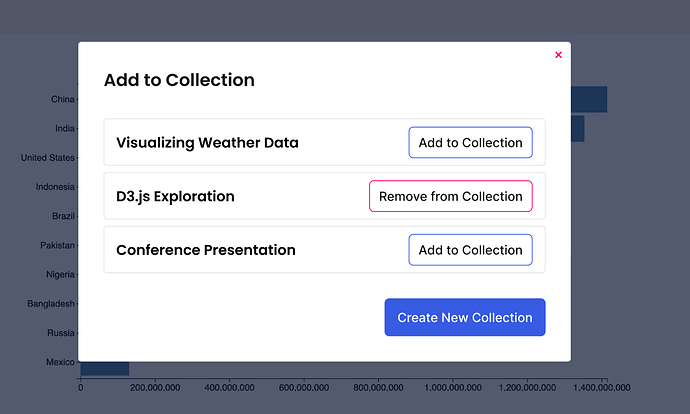
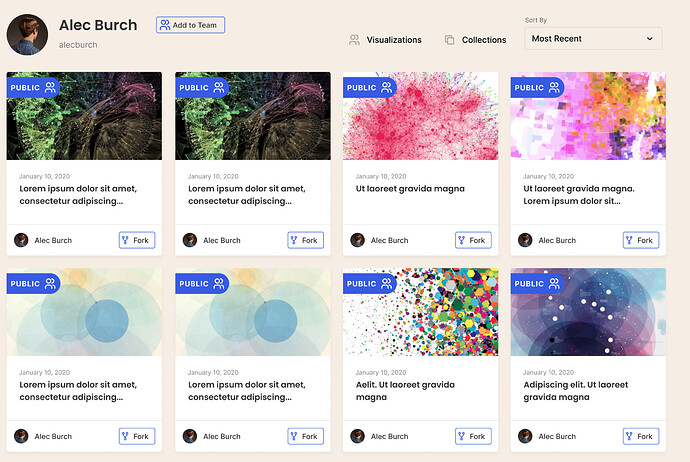
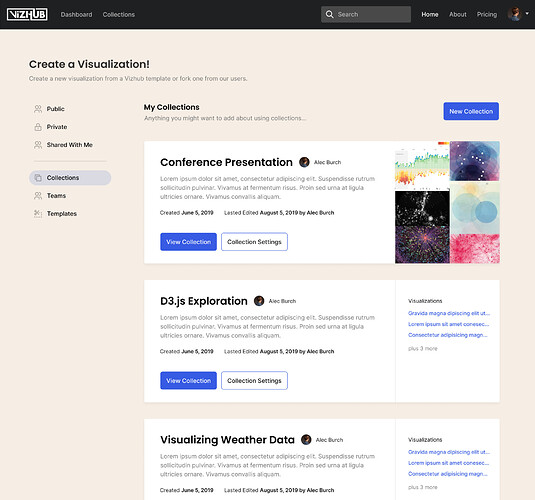
Dropping some screen shots here of designs for this feature - see also Collections GitHub issue

These designs may be implemented one day, or something like them.

The screen shots look so good!!!

The designs look modern, professional and overall, just pleasing to look at.

I see that there is “Templates” category as well.

I guess that’s for isolating starter templates in one place…? I would love that feature.

I am looking forward to seeing Vizhub with that kind of design and features.

Thank you for sharing them.

1 Like

Thanks for this feedback! Great to hear.

I’m also looking forward to building VizHub into a more useful tool, with more features around organization.

Indeed, it is my dream to one day have thousands of well organized and extremely high quality reference examples for all sorts of visualization types, and also expanding into additional areas like simulations, complex systems, UI design, and 3D work.

1 Like