
Hello,
I recently find out this awesome site. Thank you to Curran and the team!
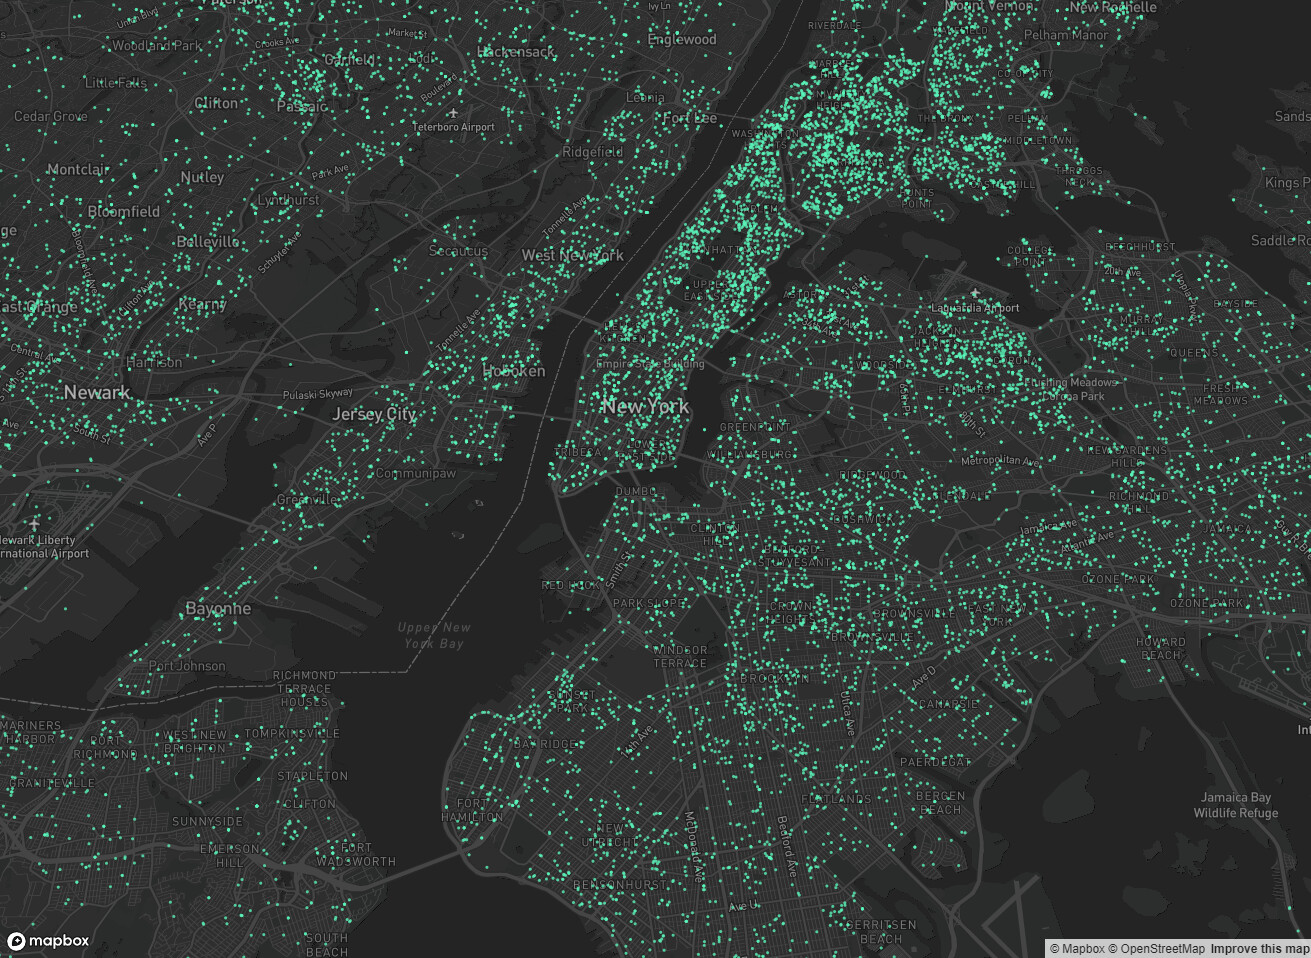
I’m currently working on a project to stream geojson data using d3 and mapbox. But, I wasn’t able to plot my data based on their types. Basically, I have three different types of gps data, when using d3 to plot them in circles, I want to fill circles with different colors based on type of the gps data. Below is part of my geojson data
{
    "type": "FeatureCollection",
    "features": [
        {
            "type": "Feature",
            "properties": {
                "hour": 2.0,
                "min": 21.0,
                "type": 1.0
            },
            "geometry": {
                "type": "Point",
                "coordinates": [
                    -74.1964708,
                    40.7105689
                ]
            }
        },
        {
            "type": "Feature",
            "properties": {
                "hour": 2.0,
                "min": 21.0,
                "type": 2.0
            },
            "geometry": {
                "type": "Point",
                "coordinates": [
                    -73.94199820000001,
                    40.6963346
                ]
            }
        },
        {
            "type": "Feature",
            "properties": {
                "hour": 2.0,
                "min": 21.0,
                "type": 1.0
            },
            "geometry": {
                "type": "Point",
                "coordinates": [
                    -73.8975397,
                    40.6398408
                ]
            }
        }
]
}
Also, I attached a screenshot of my visualizations here:
Here is the function I used to create circles on the map:
async function createDots(data) {
        var colors = ['blue', 'green', 'yellow', '#59f3b8'];
        var container = map.getCanvasContainer();
        var svg = d3
          .select(container)
          .append("svg")
          .attr("width", "100%")
          .attr("height", "2000")
          // Ensure d3 layer in front of map
          .style("position", "absolute")
          .style("z-index", 10);

        var circles = d3.select("svg")
          .selectAll("circle")
          .data(data.features)
          circles
            .exit()
              .remove();
          circles
            .enter()
            .append("circle")
              .attr("r", 1.5)
              .style("opacity", 0.8)
              //.style("fill", colors[3]) // fill data.color?
              //.style("fill", function(d){ if (d.Fruit == "strawberry") {return colors(d.Year)} else if (d.Fruit == "grape") {return colors1(d.Year)} else {return colors2(d.Year)}})
              // data.features[0].properties.type
              .style("fill", function(data, i) {
                  return colors[data.features[i].properties.type];
                })
            .merge(circles)
              .attr("cx", function(d) {
                return project(d.geometry.coordinates).x;
              })
              .attr("cy", function(d) {
                return project(d.geometry.coordinates).y;
              });
      }
Any suggestions are much appreciated.
Thank you so much!
Yapan