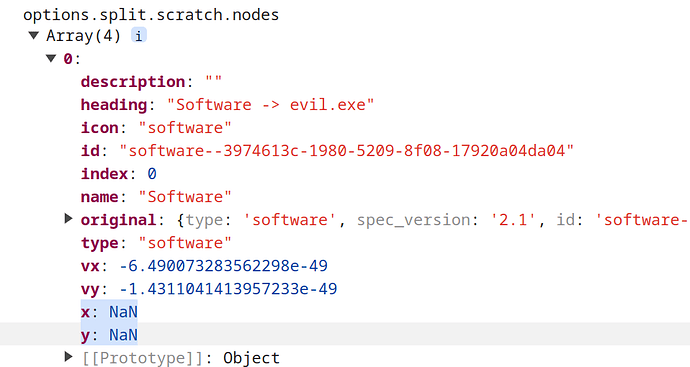
Hi @curran I have a twin-svg panels viz, with twin force graphs that is failing on x, y NaN errors.
Temp 2 Level (vizhub.com)
The index.js file opens the initial data file and then passes data back and forth between the four functions in the working.js file that drive the data splitting and visualisations:. We had to chop things up to force the promises to resolve.
- Initialise SVG: Sets up the SVG’s, borders, and labels
- Split the data into Two Separate Nodes and Edges Graphs, “Promo” and “Scratch”
- Add all of the nodes, edges and labels to the Graphs
- Setup and turn on the simulation
So data/scratch.json contains the initial graph of nodes and edges data before it is split… The adjacency List is used to split the graph according to a condition, into two sub-graphs promo and scratch. This works fine as can be seen in the console. I’ve spent a lof time trying alternatives but have not been able to fix this.
I must be doing something stupid, but non-obvious. Can you help please? Why wont this visualisation work? What am I missing here? Please help

