My First "Data Art"

I got inspired from @Nita’s work to play with randomly generated data with D3… with an artsy touch. :sparkles:

Because I came here from statistics, I felt obliged to draw from a normal distribution, which gave that imperfectly symmetric pattern. It also changes colors with a little setInterval code.

What do you think?

Edit: I added some more:

7 Likes

This is beautiful!

Perhaps we could ask for a “Data Art” or “Generative Art” as a forum category. I’d love to see more of this kind of work - D3.js never fails to impress.

2 Likes

Thanks!

That would be cool… I’d love to see (and do) more work in that category.

1 Like

This is amazing! I just created the Generative Art Category.

2 Likes

That art is so good with animations. :boom:
:slightly_smiling_face: I am also in random numbers, I did statistical data analysis with R. I like math and numbers. I remember the first time I made random colorful circles, it was a wow moment. Art side of data viz is just amazing!

2 Likes

Some stuff I have done in this area:

4 Likes

We are far behind :upside_down_face: you @curran

I agree with Nita here… Wow! That’s some serious :boom: :exploding_head: stuff here.

Not that far behind! Even ahead in certain dimentions. Your stuff is amazing @Nita :

3 Likes

Thank you. But Curran makes some crazy fractals.

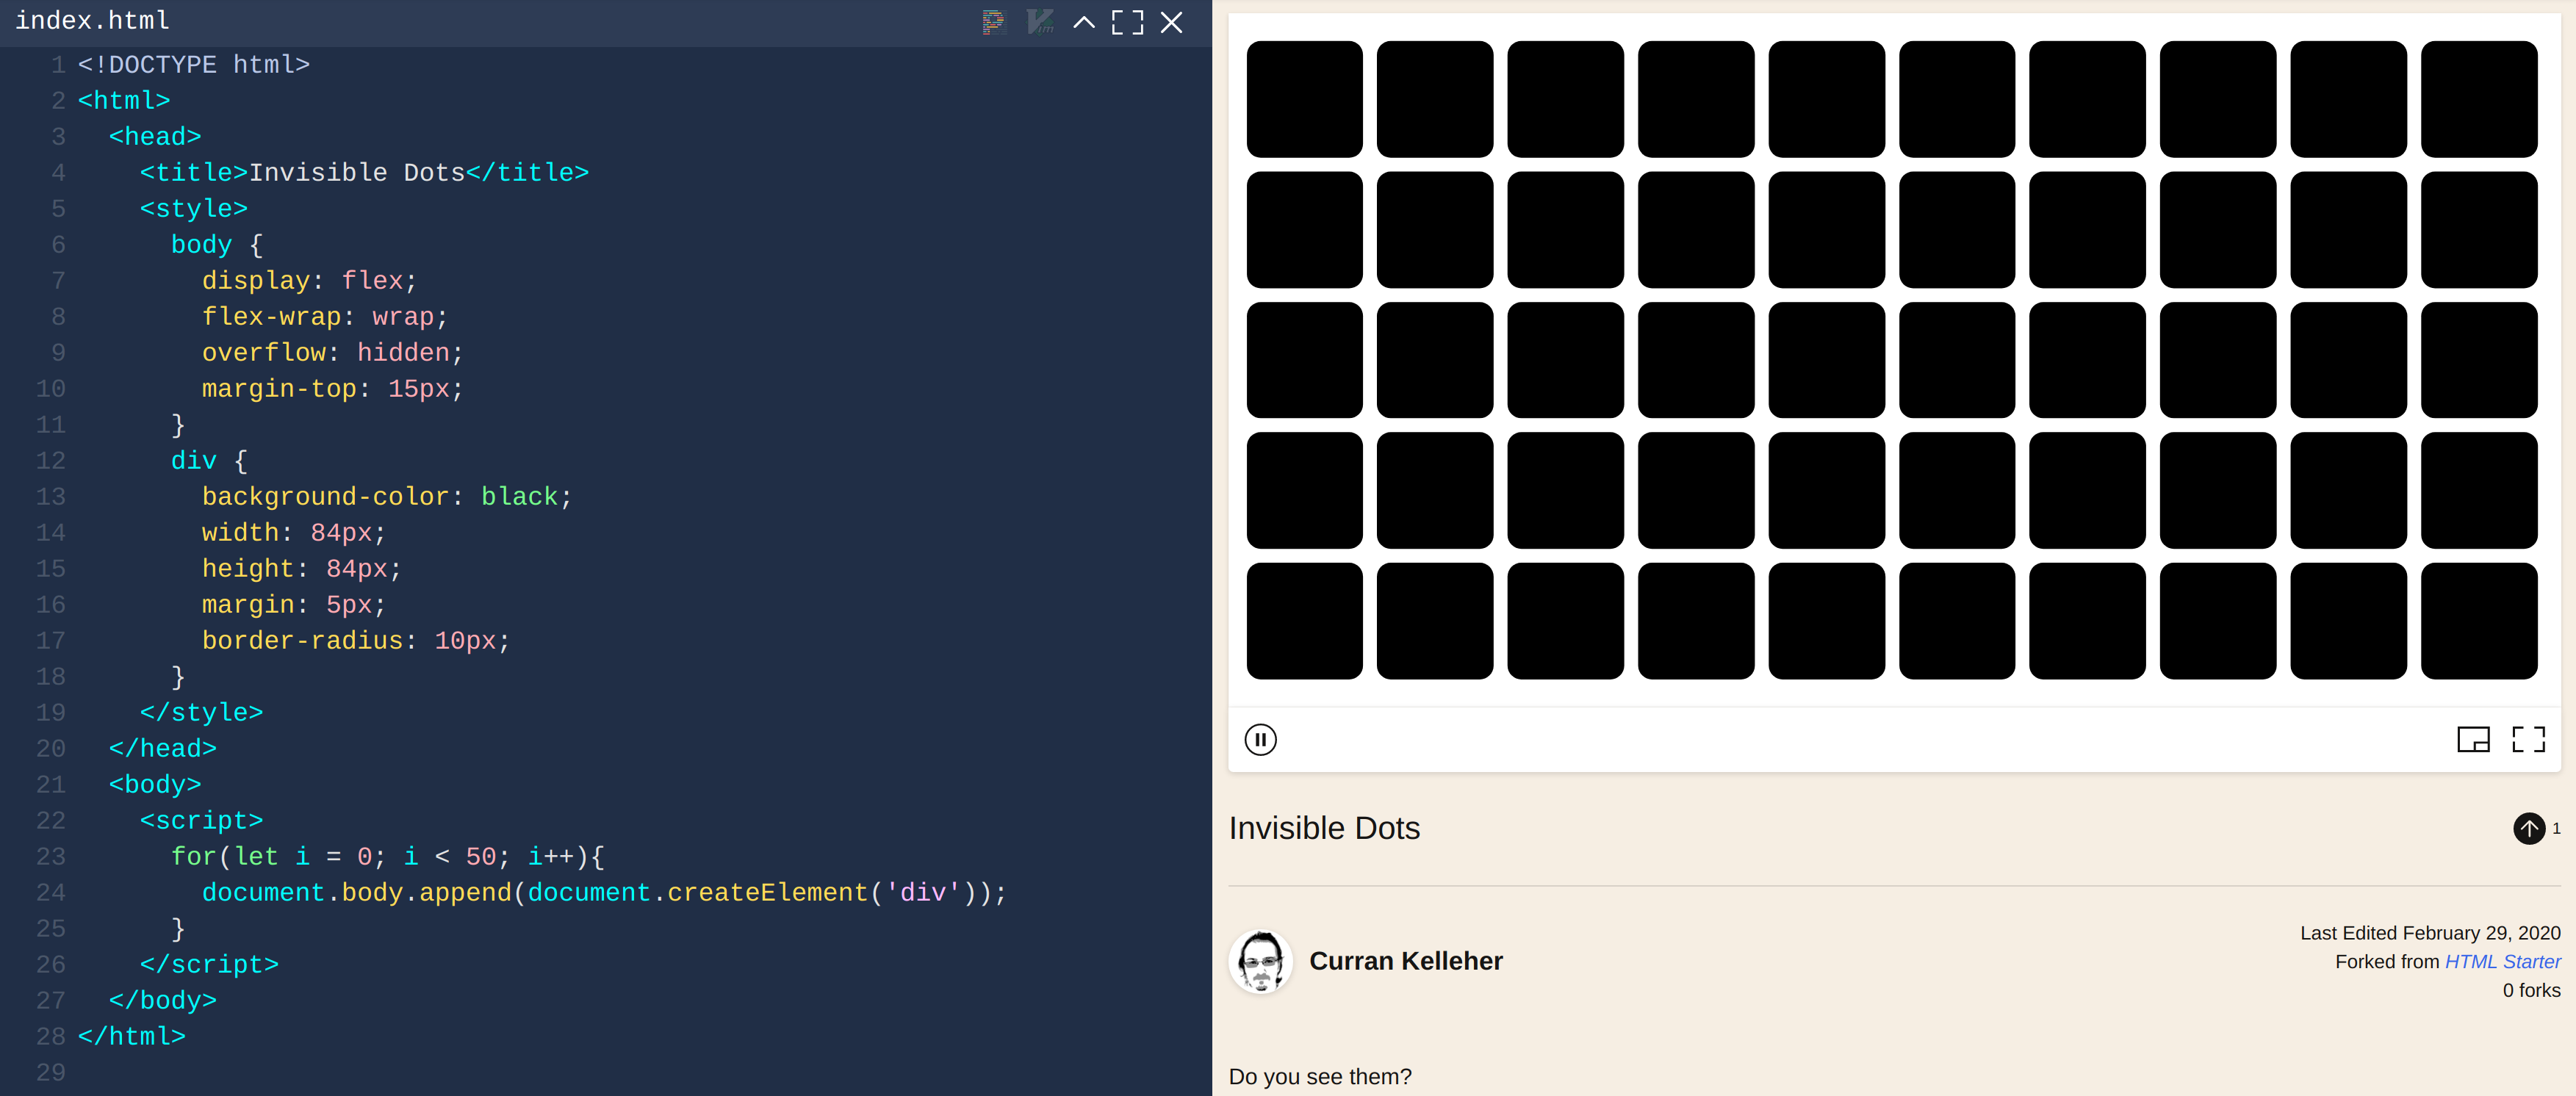
I like how you made that Invisible Dots one without any libraries. Just JS for the loop and a little Flexbox magic.

Simplicity. :ok_hand:t2:

Thanks! Yeah I love how that invisible dots piece is so small and self contained, but also gets at an interesting visual effect.

image

That reminds me, I was thinking to do a video for this piece - this would go well as an early video in the Datavis 2021 series, which I’m planning now.

4 Likes

I love this thread.