
I wanted to share my most recent project and ask for your opinion.
The forest plot, if you’re not familiar, is not an original idea of mine. It is pretty common in the medical field. Here is how it works:
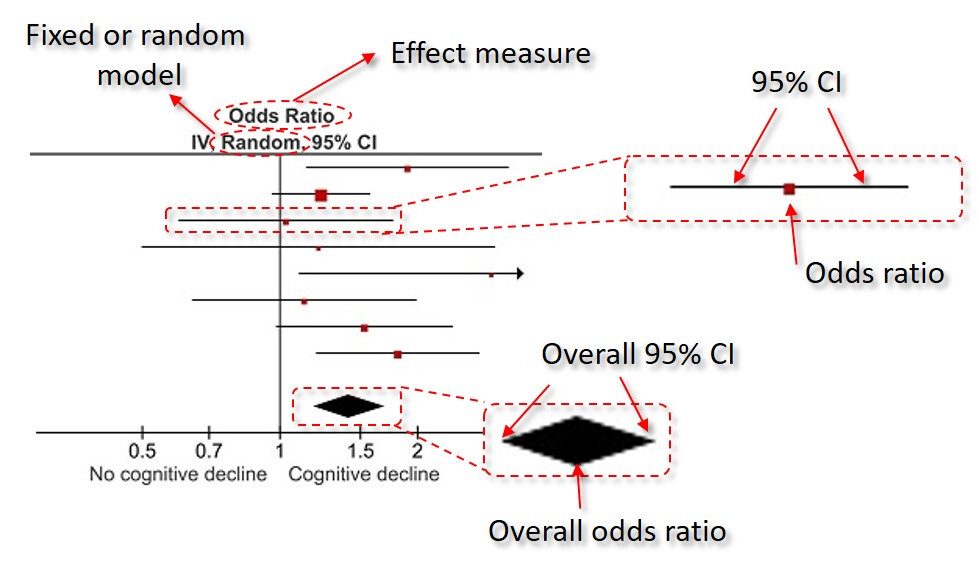
My own addition is adding these bands behind each interval and making them superimposed over each other to enhance the visualization of the degree of overlap between intervals. This should be useful because we usually want to examine the heterogeneity of treatment effect across multiple studies (i.e. intervals).
So, more overlap means bigger dark areas which in turn indicates low heterogeneity.
What do you think?