Exercise:
- Fork & Modify what we created, or
- Add lines between the circles

Here is my piece inspired by the sisyphus table.
curran thnks for the wonderfull series. I just can not get this thing running locally with vscode+liveserver+chrome browser with all 5 files present in the directory? Any suggestions?
@cenkt You will need to run the bundle step manually after exporting from VizHub. The export contains a package.json file that specifies dependencies for the build. You’ll need to run npm install to install dependencies, then run npm run build to generate bundle.js from the source modules.
VizHub exports a minimal setup using Rollup to generate the bundle. Alternatively you can start from pretty much any JavaScript starter using tools like Rollup, Webpack, or Parcel. If you drop the source files from VizHub into one of those starters, everything should “just work” if the starter understands ES6 modules. The differences probably lie in what index.html looks like, and how the bundle is included there.
I was thinking maybe the next episode can be all about this stuff.
@curran I was able to run locally by adding:
src=“https://d3js.org/d3.v5.min.js”
src="./index.js"
to index.html and calling d3 functions with “d3.” prefix in index.js. But no luck at import statements. Will be great if we can spend at least a few minutes on this. TIA.
Totally. I plan to devote the next episode to all this stuff. Thanks for the suggestion!
I did not do much this time for the assignment but looking forward to learning and creating cool stuff. 
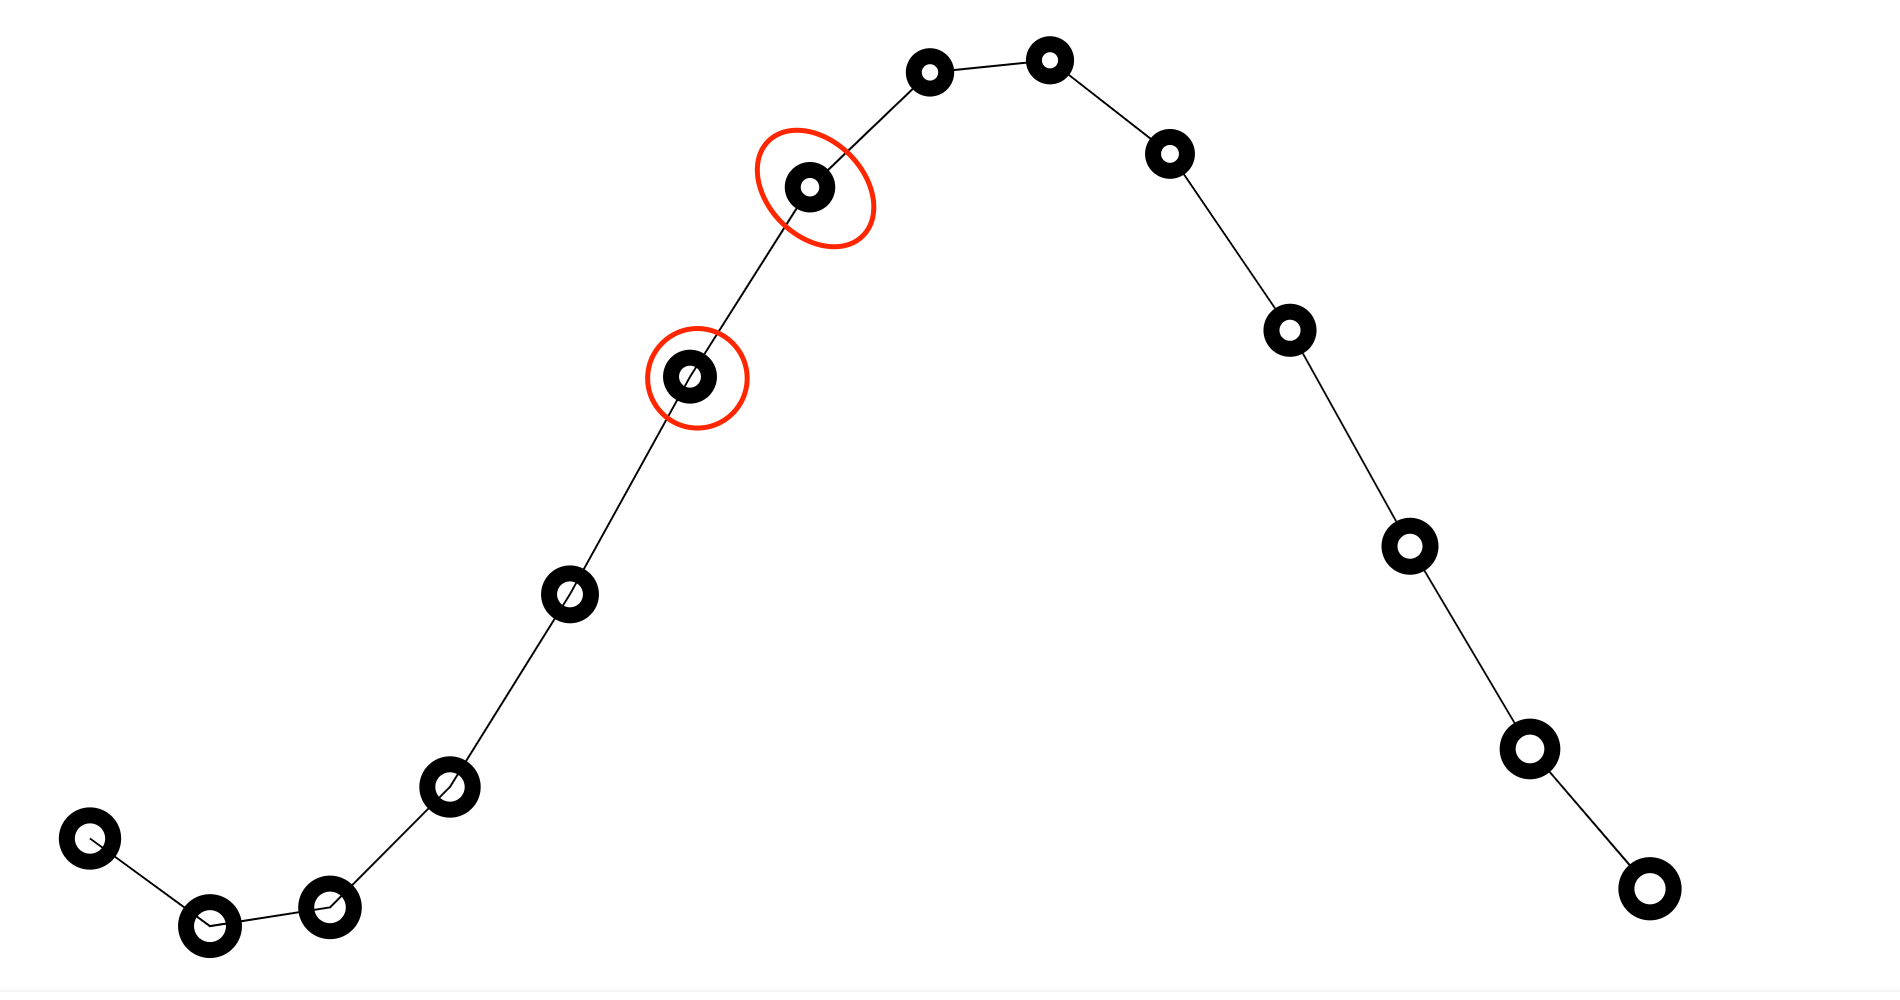
Connecting the dots with lines:
Here is my solution for the exercise:
I just used a reduce function to compute the lines set and I put such a code in the vizData module. I put the code there, since it resembles much more a processing for the viz rather than a raw data creation.
  const lines = data.reduce((accumulator, currentValue, index) => {

    const nextElement = data[index + 1];
    if(typeof nextElement !== 'undefined') {
      accumulator.push({
        'x1' : currentValue.x,
        'y1' : currentValue.y,
        'x2' : nextElement.x,
        'y2' : nextElement.y,
        'r': currentValue.r,
      });
    }
    return accumulator;
  }, []);
Then I exploited the selectAll / data / join pattern to build lines and keep them up to date.
Not sure if there is an easier way to achieve that. Peeking in the @adilzeshan solution, I guess there is, but I didn’t find anything else to get this exercise done when I looked into my JS/D3 toolkit.
And here is a kind of lollipop trees collection, rising and falling with a sin-like pace
Whooo great! I finally got it. For those interested in it, @adilzeshan and @curran explain this approach based on a D3’s line generator here. Very clean and elegant!
You might want to get rid of this little difference in the path overlapping
You can just invert the order of the circle and the path selections putting the path selection first. Working this way, the new items created in the enter / update pattern follow the same “z” rule. e.g.,
Still not sure about the reason why this issue is happening only in the reverse order.
EDIT:
Just wanna share my Aha-moment! This happens due to the order we are modifying the DOM with, using the enter / update / exit (aka join) pattern!
If we have:
selection
    .selectAll('circle')...

selection
    .selectAll('path')...
our starting dom looks like:
<circle></circle>
<circle></circle>
.
.
.
<circle></circle>
<path></path>
The path element is a kind of a singleton that is only going to change values in its d attribute respect to dots coordinates! And this is perfectly fine. However, when we start to iterate over time, new circles are added and removed after the path element, thus creating a kind of mismatch in “z” ordering!
In this case we have:
selection
    .selectAll('path')...

selection
    .selectAll('circle')...
therefore our DOM looks like:
<path></path>
<circle></circle>
<circle></circle>
.
.
.
<circle></circle>
This time, all new circles are appended in a consistent z ordering.
Now, I can exit from this rabbit hole! 
Very nice! An alternative way to deal with constent ordering would be to put the circles into a group element. Great work!
Thanks! Yes, group element! Super suggestion. The simpler way I’ve found is the following:
selection
   .selectAll('g')
   .data([null])
   .join('g')
   .selectAll('circle')
   .data(data)
   .join('circle')
    ...
The orders of the selections still matters. E.g., here you have the path over all the (grouped) circles:
Very nice! That’s perfect. The .data([null]) is a great way to handle it.
Trying to catch-up on the Exercises. Here’s my attempt at plotting the sine and cosine curves - keeping in with the “black and white” theme 
Added a connecting line using lineGenerator function in ‘d3’.
I tried making the DNA shape , but this is all i got 
thanks to Adil’s code i was able to connect the dots vertically.
Hey that’s pretty darn good! Try forking and varying parameters until it’s really cool.
Circles change colour and size with time and form a massive worm