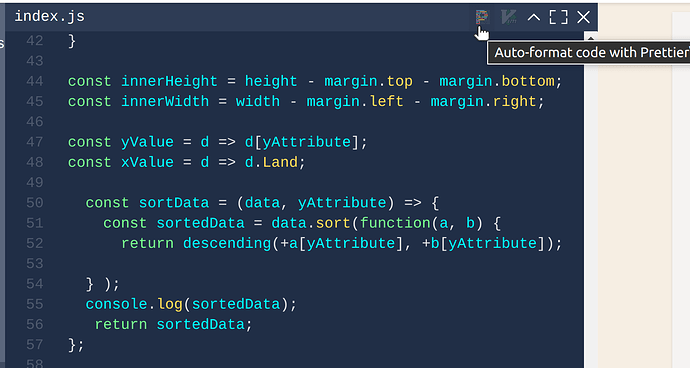
I was reading through the code and found it disortienting regarding formatting.
I would suggest, as a first step, to use Prettier to auto-format the code (by clicking that “P” icon). This will fix indentation and placement of brackets, so the code is easier to read.
Another thing I would suggest is to leverage useMemo to compute the sorted data.
So instead of
<Marks data={sortData(data, yAttribute)}
you could do something like this:
const sortedData = useMemo(() => sortData(data, yAttribute), [data, yAttribute]);
...
<Marks data={sortedData}
That’s all just stylistic things though - I think your bug might be due to this line:
key = {yValue(d)}
in Marks.js. My guess is that the key of the Y value is not unique (some entries have the same value), so that’s why duplicated bars are showing up. Suggestion: use the X value as the key instead, where they are guaranteed to be unique.
Good luck!


