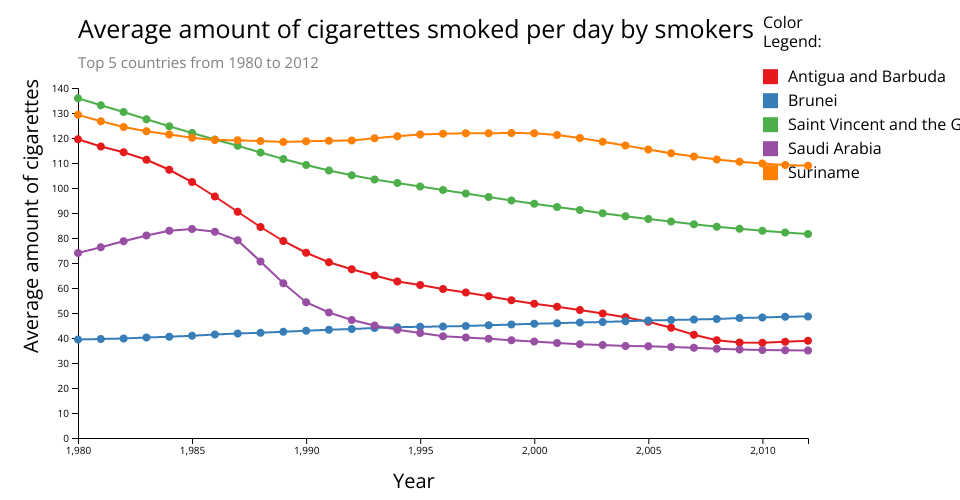
Multi-line Chart visualization of the average amount of cigarettes smoked per day by smokers of only top 5 countries from the CORGIS dataset 'https://corgis-edu.github.io/corgis/csv/smoking/' in D3. Color legend from Susie Lu and colorbrewer.
MIT Licensed