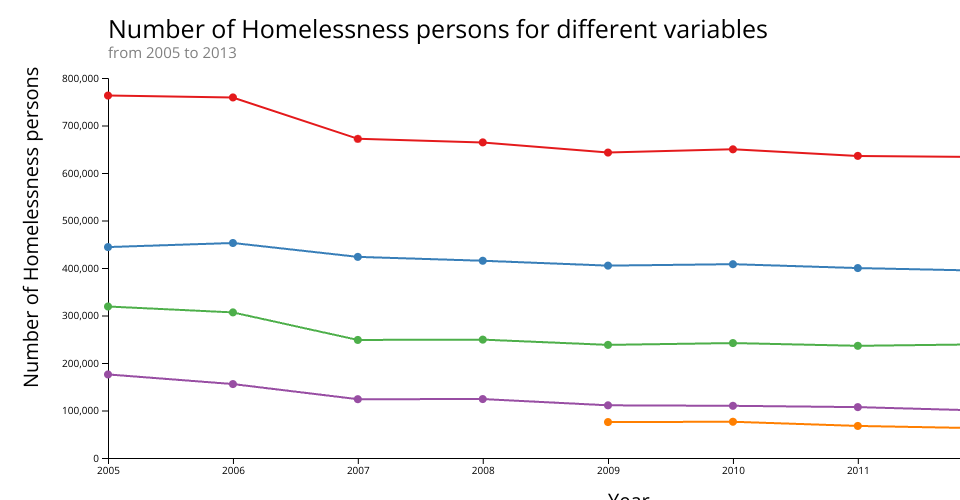
Multi-line Chart visualization of the average amount of cigarettes smoked per day by smokers of only top 5 countries from the CORGIS dataset 'https://corgis-edu.github.io/corgis/csv/smoking/' in D3. Color legend from Susie Lu and colorbrewer.
const x = d3 .scaleTime() .range([0, width]) .domain([ d3.min(data, function (d) { return new Date(d.year); }), // Assuming d.year is a string representing a date d3.max(data, function (d) { return new Date(d.year); }), ]);
MIT Licensed