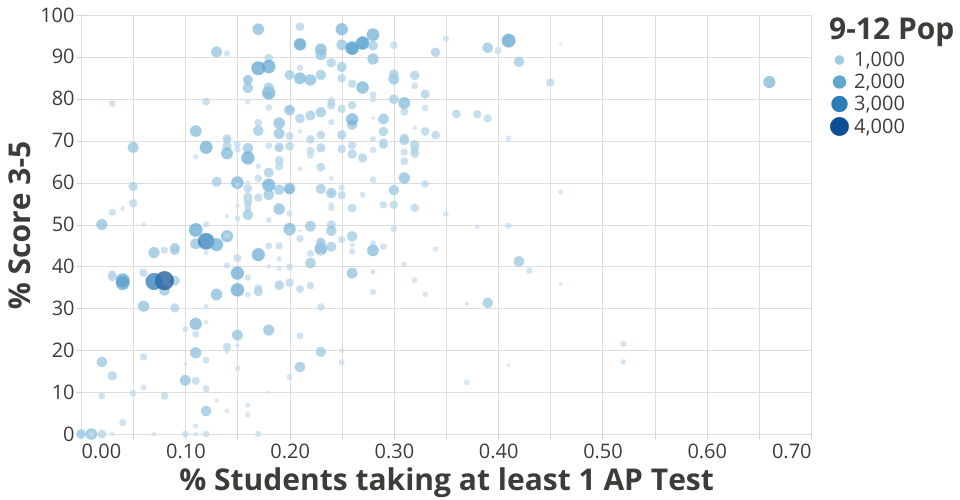
Bubble chart showing Massachusetts HS participation rates compared to success (AP scores 3+). Color and size show the size of the Massachusetts High School.
MA DESE AP Performance data comes from a public DESE repository.
MIT Licensed
Bubble chart showing Massachusetts HS participation rates compared to success (AP scores 3+). Color and size show the size of the Massachusetts High School.
MA DESE AP Performance data comes from a public DESE repository.