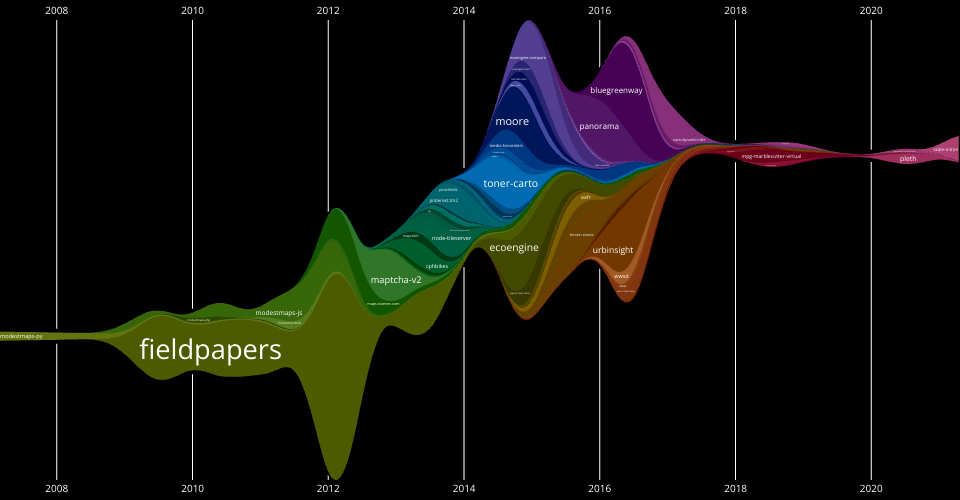
This is an experiment in visualizing Stamen's Open Source activity over the years. Each layer is a D3 repository. The thickness of each layer is the number of commits per week with smoothing applied. This visualization uses a modified Streamgraph technique where the layer order is determined by the time of the first commit. So, as you read the labels from bottom to top, that corresponds to the history of when each repository was introduced.
On the whole, one can see that development occurred in the original monolithic d3 repository from late 2010 to mid 2014. In late 2014 we see an explosion of packages, corresponding to the 4.0 release of D3. Since that great explosion, we see a big push on d3-delaunay in 2018, and ongoing development/maintenance work pretty evenly distributed across the various D3 packages.
This piece was created as a submission for D3 Parade 2021.