Resources
Contact
Pricing
🇺🇸
EN
Log in
Open Editor
Revision History
Export Image
Share
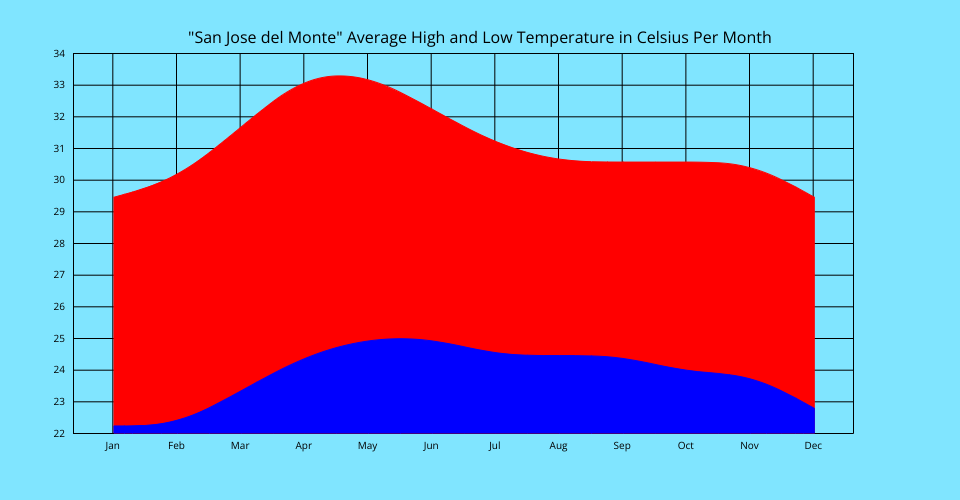
Average High and Low Temperature in San Jose del Monte By Month Area Chart
1
Fork
0
Likes
Christian June Gregorio
0 views in last 90 days
Last edited Sep 26, 2022
Created on Sep 26, 2022
Forked from
Average High and Low Temperature in San Jose del Monte By Month Line Chart
uses
v2 runtime
The data from this graph is taken from
weatherspark.com
MIT Licensed