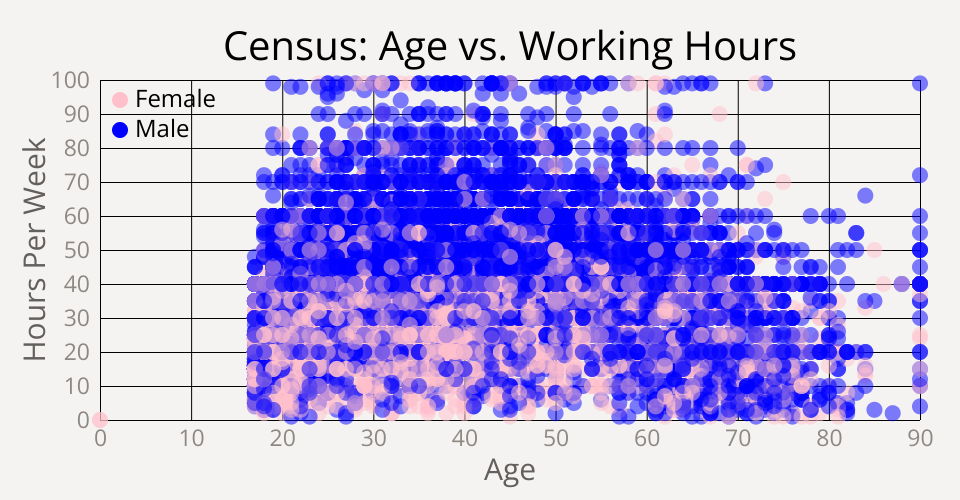
This chart shows the working-hours of working-class people in comparison with their age and gender. The data comes from the Census Income Data Set extracted by Barry Becker in 1996 from the 1994 Census database.
MIT Licensed
This chart shows the working-hours of working-class people in comparison with their age and gender. The data comes from the Census Income Data Set extracted by Barry Becker in 1996 from the 1994 Census database.