Iris Dataset Scatter Plot
An interactive scatter plot visualization of the famous Iris dataset built with D3.js and the d3-rosetta library. This visualization demonstrates the unidirectional data flow pattern for creating reusable, framework-agnostic data visualizations.
Features
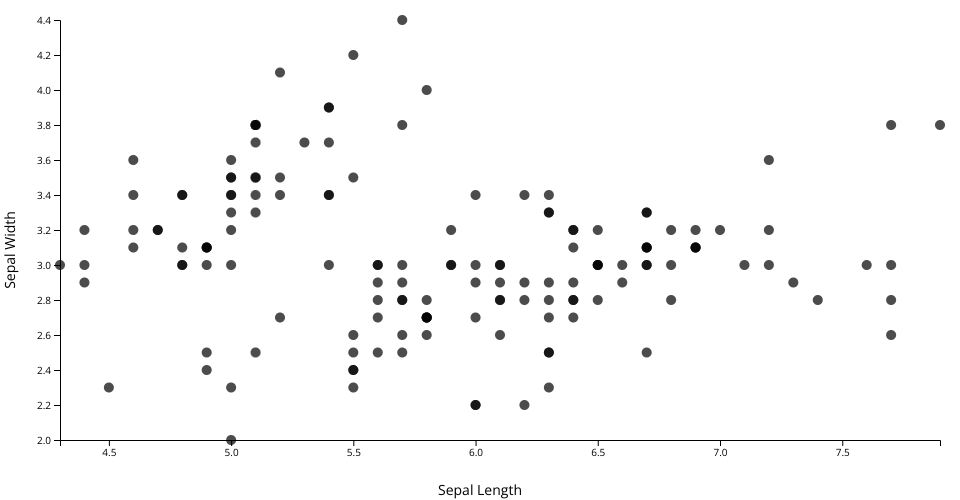
- Scatter plot visualization showing the relationship between sepal length and sepal width
- Asynchronous data loading with loading states and error handling
- Responsive design that adapts to container dimensions
- Clean architecture using the unidirectional data flow pattern
- Modular codebase with separation of concerns
What it shows
The visualization displays:
- X-axis: Sepal Length (cm)
- Y-axis: Sepal Width (cm)
- Data points: Each circle represents one iris flower sample
- Dataset: 150 iris flower measurements from the classic iris dataset
Architecture
This project demonstrates modern D3.js patterns using d3-rosetta:
Core Pattern
- Unidirectional Data Flow: Single
vizfunction handles all rendering logic - State Management: Centralized state with immutable updates
- Idempotent Rendering: Safe to call multiple times without side effects
Key Files
viz.js- Main visualization entry pointscatterPlot.js- Scatter plot rendering logicloadAndParseData.js- Data loading and parsingconfig.js- Visualization configurationsetupSVG.js- SVG container management
Utilities Used
createStateField()- Simplified state property managementone()- Single DOM element management- Async request handling with loading states
MIT Licensed