Streamgraph with d3-area-label
This project demonstrates a streamgraph visualization using D3.js with automatic label placement using the d3-area-label library.
Features
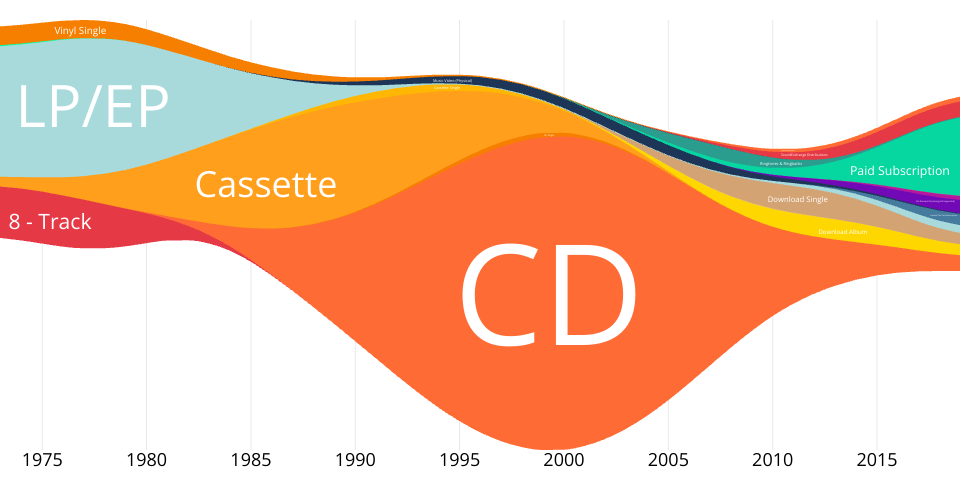
- Stacked area chart (streamgraph) showing revenue data by format over time
- Automatic label placement using d3-area-label
- Interactive visualization built with React and D3.js
Dependencies
- React 19.1.0
- D3.js 7.9.0
- d3-area-label 1.6.0
Files
index.html- Main HTML file with import mapsindex.js- React application entry pointApp.js- Main React componentviz.js- Main visualization orchestratorprepare-data.js- Data transformation and stacking logicscales.js- Scale creation (x, y, color)render-areas.js- Streamgraph area renderingrender-labels.js- Area label rendering with d3-area-labelaxis.js- Axis renderingaxis-labels.js- Axis label renderingcolors.js- Color scheme definitiondata.csv- RIAA US music revenue data
Dataset
The dataset (data.csv) contains US music industry revenue
data by format from 1973 to 2019. It was downloaded from
https://www.nic.uoregon.edu/~khuck/d3/d3-7.9.0/docs/public/data/
(filename: riaa-us-revenue.csv).
The data is sourced from the Recording Industry Association of America (RIAA) at https://www.riaa.com/.
Data Format
The CSV contains the following columns:
format- Music format (e.g., "CD", "8 - Track", "Cassette", "Download Single", "Streaming")group- Format category (e.g., "Disc", "Tape", "Download", "Streaming")year- Date in YYYY-MM-DD format (always January 1st of the year)revenue- Revenue in millions of dollars (inflation-adjusted)
The dataset tracks the evolution of music consumption formats and their respective revenue contributions over nearly five decades, showing the rise and fall of physical media, the digital download era, and the emergence of streaming services.
MIT Licensed