Pseudo Scatter Plot with D3
This project creates a simple scatter plot visualization using D3.js. It renders circles at specific (x, y) coordinates on an SVG canvas that fills the entire browser window.
Features
- Full-screen SVG visualization
- Responsive design that adapts to window size
- Static data points rendered as circles
Project Structure
index.html: Main HTML file that sets up the visualization container and imports the necessary modulesindex.js: Entry point that initializes the visualizationviz.js: Core visualization function that orchestrates SVG setup and circle renderingdata.js: Contains static data points for the scatter plotsetupSVG.js: Function to create and configure the SVG elementrenderCircles.js: Function to render data points as circles on the SVG
Data Points
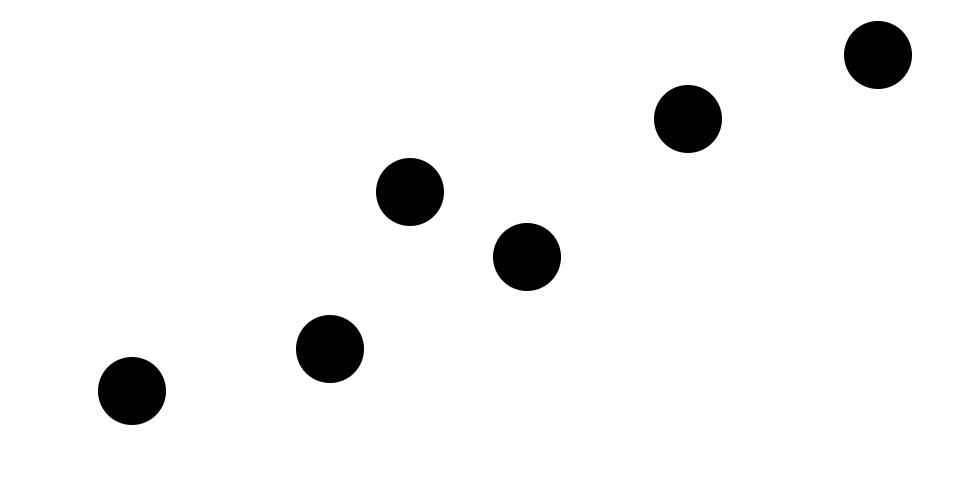
The visualization displays the following data points:
- (132, 391)
- (330, 349)
- (410, 192)
- (527, 257)
- (688, 119)
- (878, 55)
Each point is rendered as a circle with a radius of 34 pixels.
How to Run
- Open
index.htmlin a modern web browser - The visualization will automatically render in full screen
Note: This project uses ES modules and requires a local
server to run properly due to CORS restrictions. You can use
a simple server like Python's http.server or VS Code's
Live Server extension.
Implementation Details
This implementation uses D3's join pattern for data binding:
select(container).selectAll('svg').data([null]).join('svg')ensures a single SVG element existsselectAll('circle').data(data).join('circle')binds data points to circle elements
The visualization automatically resizes to fill the browser
window using CSS position: fixed and inset: 0
properties.
MIT Licensed