Gender Pay Gap Visualization with D3.js
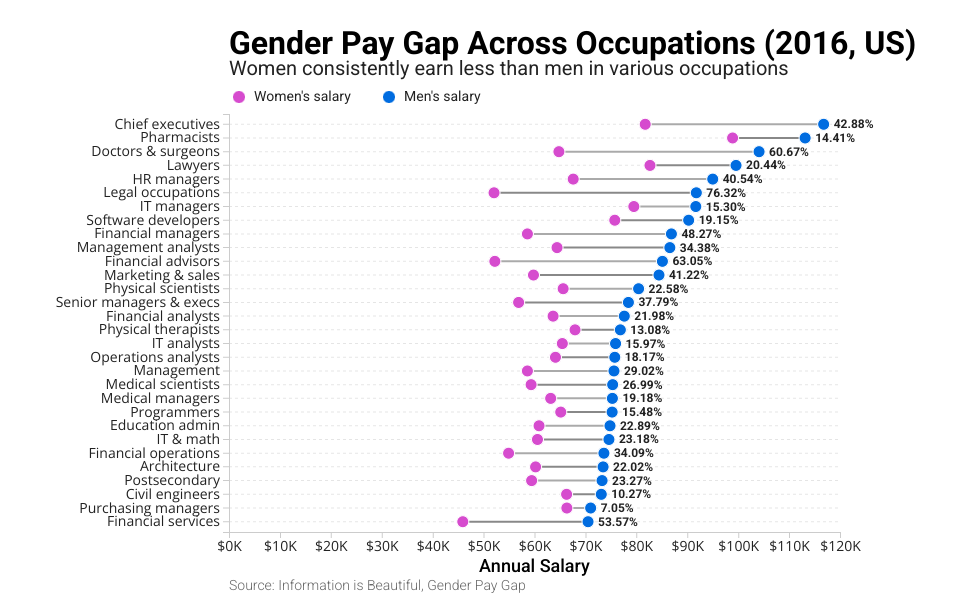
This project visualizes the gender pay gap across various occupations using a dumbbell chart created with D3.js. It highlights disparities in salaries between men and women for different job categories.
What is D3?
D3 (Data-Driven Documents) is a JavaScript library that enables dynamic, interactive data visualizations in web browsers using HTML, SVG, and CSS.
About This Project
This visualization uses salary data for men and women across multiple occupations to illustrate differences in earnings. Each dumbbell represents an occupation, with endpoints showing the average salaries of men and women, and a line connecting them to depict the pay gap.
How This Works
The Code Structure
This project consists of the following key files:
index.js: The main entry point that loads data and orchestrates rendering.data.js: Handles loading and formatting the salary dataset.renderSVG.js: Creates and configures the SVG container.renderDumbbellChart.js: Contains logic for rendering the dumbbell chart.observeDimensions.js: Enables responsiveness by tracking container size.config.js: Stores layout and appearance settings.theme.js: Defines color schemes and font styles.styles.css: Contains CSS styles for the visualization.
Key D3 Concepts Used
- Scales: Mapping data values (salary amounts) to visual properties.
- Axes: Creating labeled axes for better readability.
- Data Joins: Using
selection.data().join()to dynamically update elements. - Transitions & Animations: Implementing smooth updates when data changes.
Getting Started with D3
If you're new to D3, here are some helpful resources:
MIT Licensed