index.js
import { csv, select } from 'd3';
import { scatterPlot } from './scatterPlot';
const csvUrl = [
'https://gist.githubusercontent.com/',
'curran/', // User
'a08a1080b88344b0c8a7/', // Id of the Gist
'raw/0e7a9b0a5d22642a06d3d5b9bcbad9890c8ee534/', // commit
'iris.csv', // File name
].join('');
const parseRow = (d) => {
d.sepal_length = +d.sepal_length;
d.sepal_width = +d.sepal_width;
d.petal_length = +d.petal_length;
d.petal_width = +d.petal_width;
return d;
};
const width = window.innerWidth;
const height = window.innerHeight;
const svg = select('body')
.append('svg')
.attr('width', width)
.attr('height', height);
const main = async () => {
const plot = scatterPlot()
.width(width)
.height(height)
.data(await csv(csvUrl, parseRow))
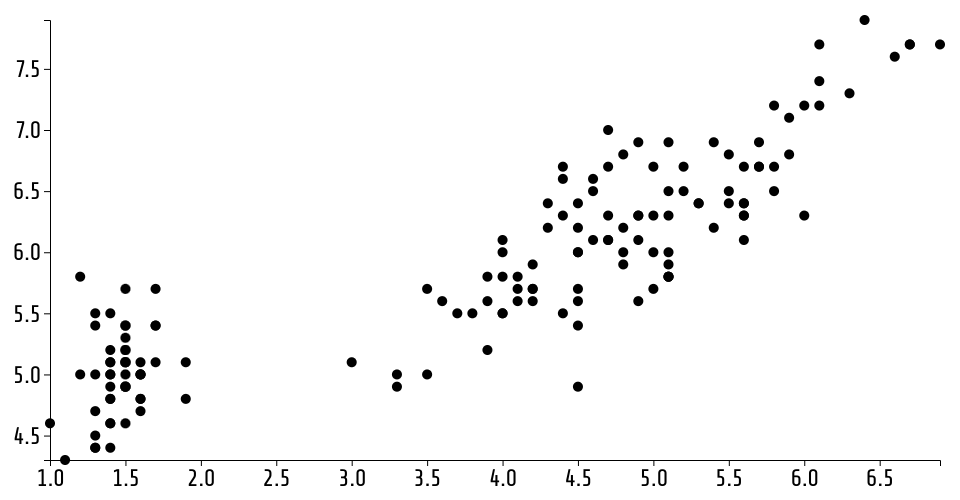
.xValue((d) => d.petal_width)
.yValue((d) => d.sepal_length)
.margin({
top: 20,
right: 20,
bottom: 40,