This example was ported from the original Observable: Chord Diagram II to Vanilla JavaScript using AI (Claude 4 Sonnet in VizHub AI).
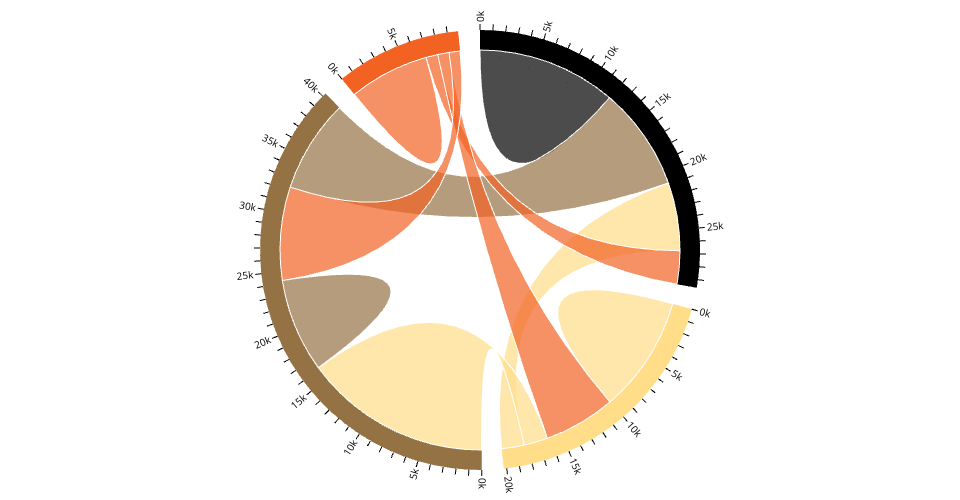
An interactive chord diagram implementation using D3.js showing directed relationships among groups. This visualization is adapted from the Observable notebook and follows a unidirectional data flow pattern.
Features
- Interactive group selection by clicking on arcs
- Hover effects on both groups and chords
- Responsive design that adapts to container size
- Tooltips showing values and relationships
- Tick marks and labels for value reference
Data Structure
The visualization uses a matrix format where each cell represents the relationship strength between groups:
MIT Licensed