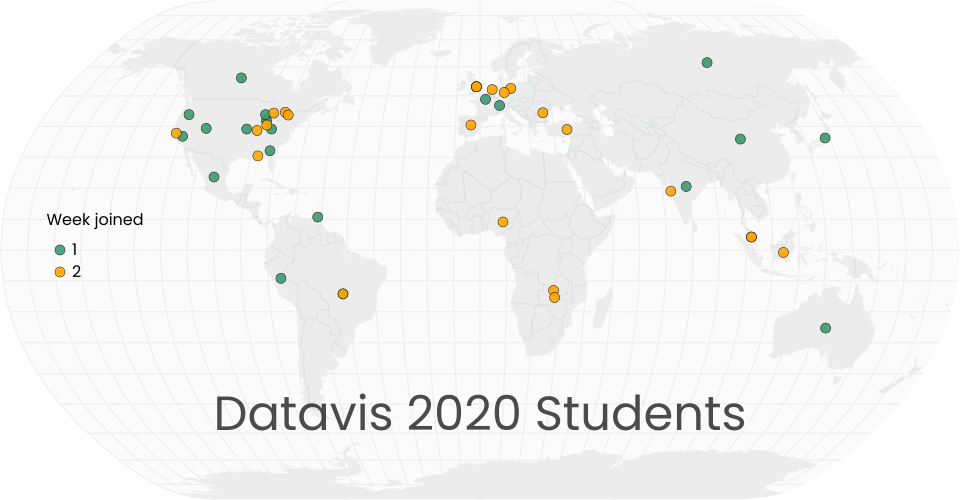
This map shows approximate locations of the students who joined Datavis 2020 in its first few days.
The list of locations was compiled by manually going through the places mentioned by students in their introductions in our Slack channel #datavis-2020 in the D3 Slack Group. These are the locations where the students are actually located physically.
Each location mentioned was geocoded using Google (example Kansas City longitude and latitude and entered into the code here in useCities.js.
The locations mentioned range from countries to states to particular cities. For regions like countries or states, the point represents its centroid. Locations are by no means exact, but the point of this viz is to give a sense of the global distribution of students.
This version includes newer data, and colors students by the week that they joined. The first week ended on Jan. 3, 2010.