index.js
import { select } from 'd3';
import { viz } from './viz';
import { data } from '@curran/penguins';
export const main = (container) => {
const width = container.clientWidth;
const height = container.clientHeight;
const svg = select(container)
.selectAll('svg')
.data([null])
.join('svg')
.attr('width', width)
.attr('height', height);
viz(svg, {
data,
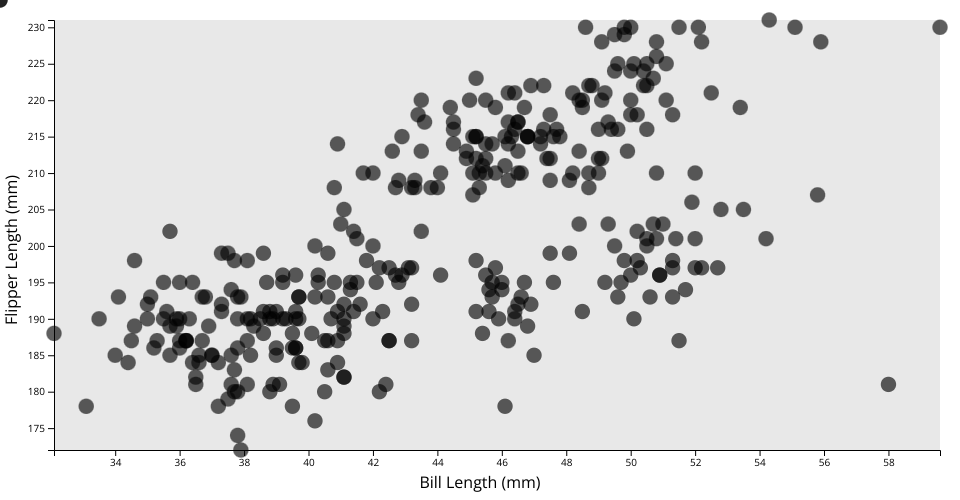
xValue: (d) => d.bill_length_mm,
xAxisLabelText: 'Bill Length (mm)',
xAxisLabelOffset: 38,
yValue: (d) => d.flipper_length_mm,
yAxisLabelText: 'Flipper Length (mm)',
yAxisLabelOffset: 17,
innerRectFill: '#E8E8E8',
Alt + Click on a hex color
Open a color picker to modify the color
circleRadius: 153 / 20,
circleOpacity: 629 / 1000,
marginTop: 20,
marginBottom: 50,
marginLeft: 54,
marginRight: 20,
width,
height,
});
// Sample row (d):
// {
A simple scatter plot with D3 showing the Penguins Dataset.
Challenge
- Fork this viz
- Modify it to show your data
MIT Licensed