Tibetan Buddhist Lineages - Global Centers Visualization
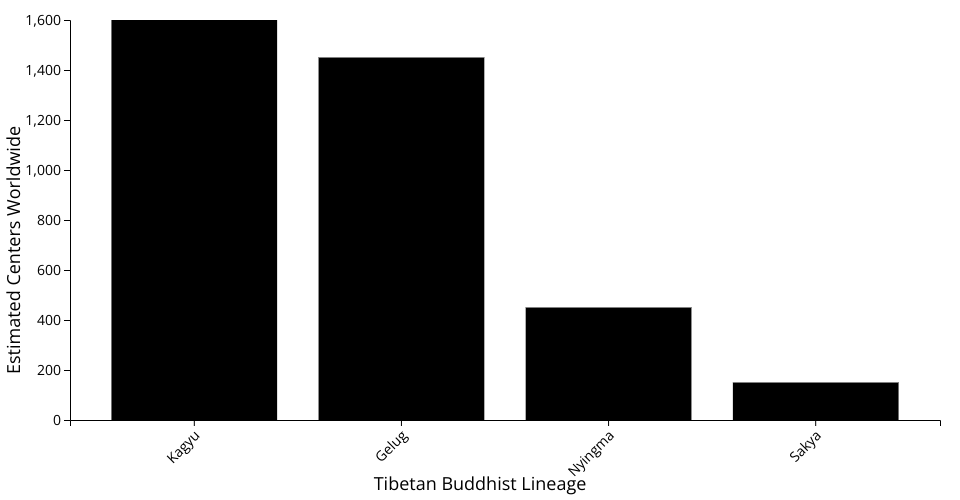
An interactive bar chart visualizing the estimated number of centers worldwide for major Tibetan Buddhist lineages.
Overview
This project displays a comparative visualization of the four main Tibetan Buddhist lineages (Gelug, Kagyu, Nyingma, and Sakya) and their global presence through estimated center counts. The data represents midpoints of estimated ranges for centers/groups worldwide.
Features
- D3.js Visualization: Bar chart built with D3.js for data-driven rendering
- React Integration: Uses React 19 with D3 for efficient component-based architecture
- ES Modules: Modern JavaScript with import maps for zero build tooling
- Responsive Design: SVG-based visualization with proper margins and labels
Data
The visualization uses data from data.csv which includes:
- Gelug: 1,300–1,600 centers (includes NKT and FPMT centers)
- Kagyu: 1,200–2,000 centers (includes Karma Kagyu, Diamond Way, and other branches)
- Nyingma: 300–600 centers (includes Rigpa and other Nyingma networks)
- Sakya: 100–200 centers (smaller global footprint)
Data represents estimated ranges; the visualization displays midpoint values for comparison.
Technologies
- React 19: UI library
- D3.js v7: Data visualization and manipulation
- ES Modules: Native browser module support via CDN
- No Build Step: Runs directly in the browser
File Structure
index.html- Entry point with import mapsindex.js- React app initializationApp.js- Main React component with data loadingviz.js- D3 visualization logic (bar chart rendering)axis.js- Axis rendering helperaxis-labels.js- Axis label rendering helperdata.csv- Source data for Tibetan Buddhist lineages
Running Locally
Since this uses ES modules with import maps, you'll need to serve it through a local web server:
MIT Licensed