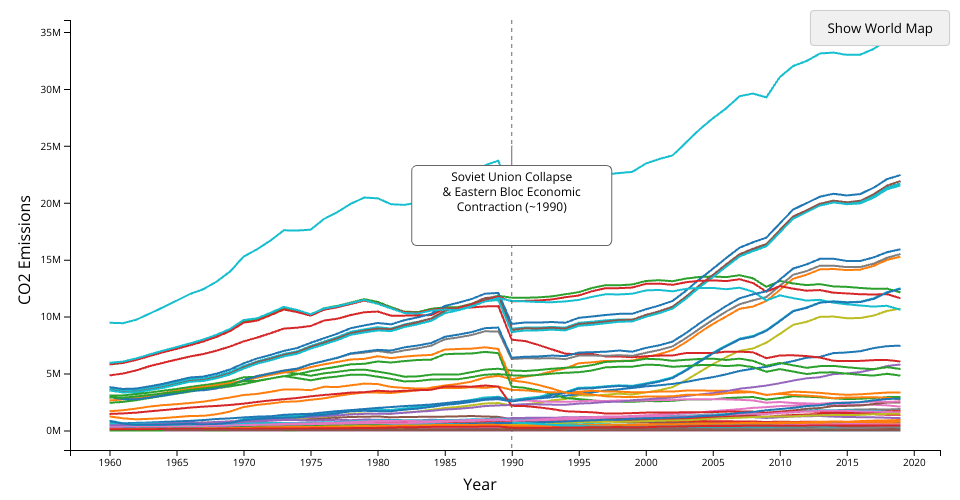
That dip you see in the emissions curve around 1990 corresponds to a well-known historical event: the collapse of the Soviet Union and the Eastern Bloc economies.
Here’s why it shows up in the data:
Industrial output dropped sharply — many factories closed or scaled back drastically during the political and economic transitions of the late 1980s and early 1990s.
Energy consumption plummeted — fossil fuel use fell as inefficient heavy industry was reduced, and many countries shifted to different economic structures.
Geographic impact — the dip is visible because Russia, Ukraine, and other former Soviet republics were large CO₂ emitters, and their combined downturn in emissions was big enough to register globally.
After 1990, emissions rise again as global industrialization continued, especially with rapid growth in China, India, and other developing economies.
👉 So the dip isn’t an anomaly in the dataset — it’s a real reflection of the post-Soviet economic contraction.
Do you want me to annotate this chart with a label marking the 1990 Soviet collapse so the context is clear for viewers?
Comments
Might be something off, surprising that dip in 1990
It's a real thing! From ChatGPT:
That dip you see in the emissions curve around 1990 corresponds to a well-known historical event: the collapse of the Soviet Union and the Eastern Bloc economies.
Here’s why it shows up in the data:
After 1990, emissions rise again as global industrialization continued, especially with rapid growth in China, India, and other developing economies.
👉 So the dip isn’t an anomaly in the dataset — it’s a real reflection of the post-Soviet economic contraction.
Do you want me to annotate this chart with a label marking the 1990 Soviet collapse so the context is clear for viewers?