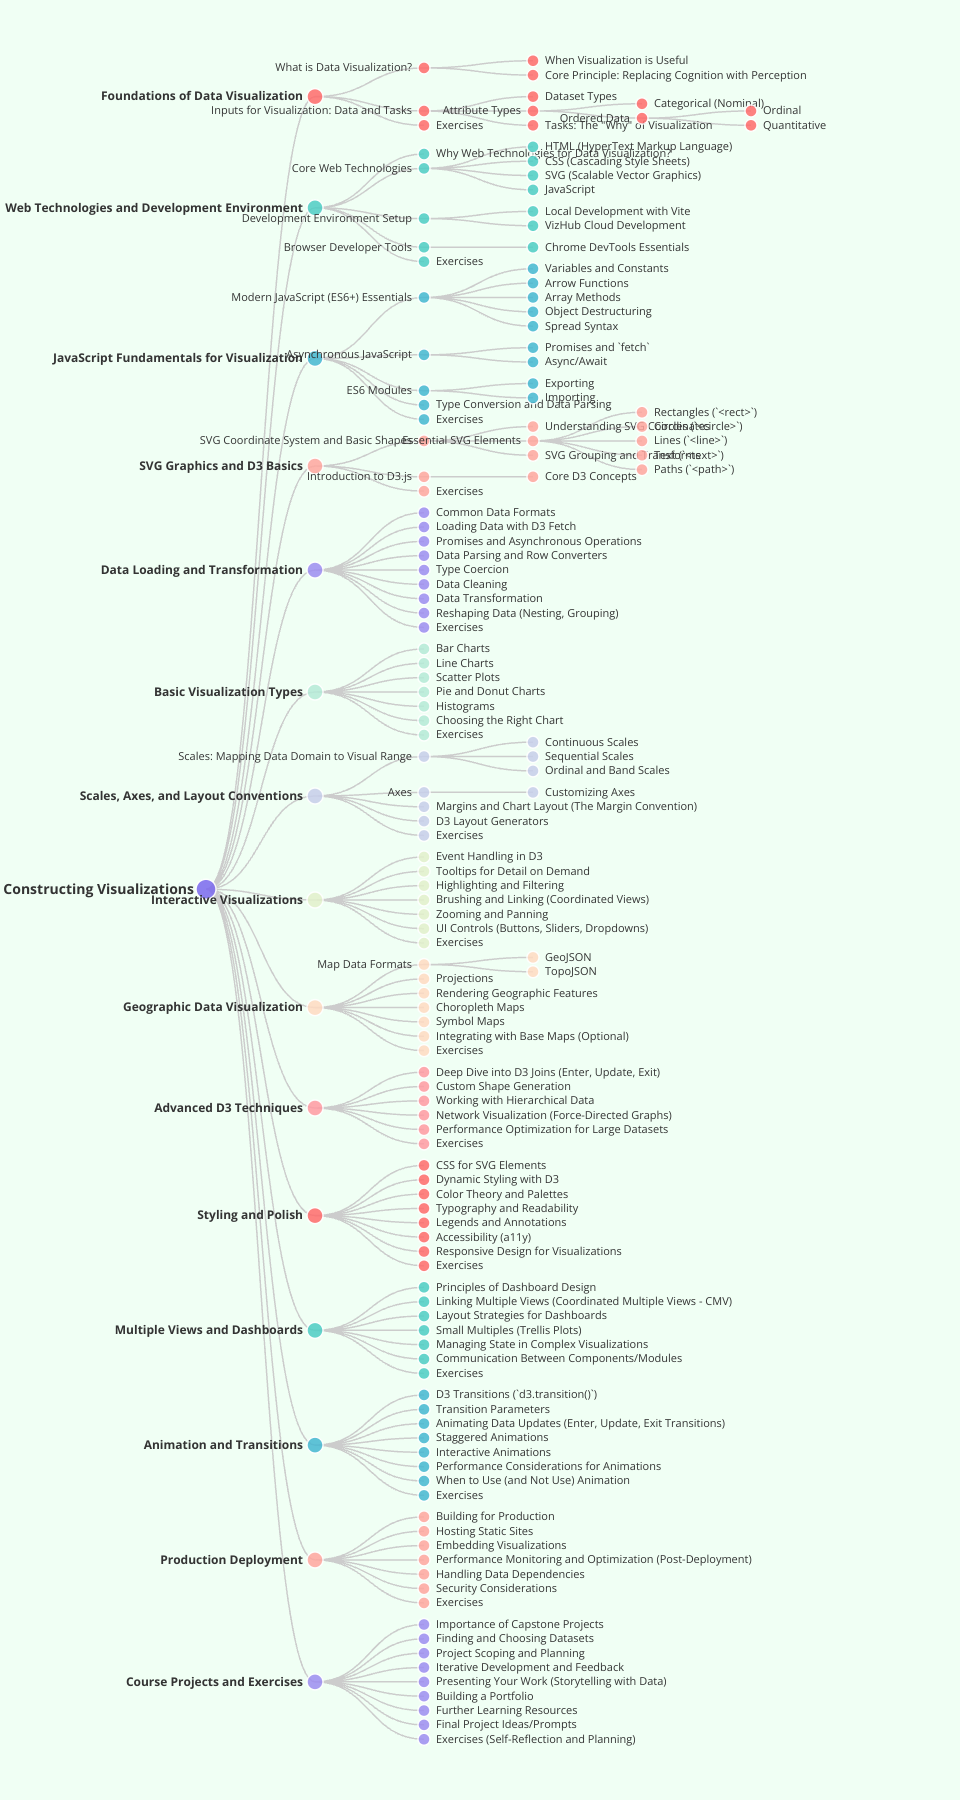
Constructing Visualizations
by Curran Kelleher
Table of Contents
- Foundations of Data Visualization
- Web Technologies and Development Environment
- JavaScript Fundamentals for Visualization
- SVG Graphics and D3 Basics
- Data Loading and Transformation
- Basic Visualization Types
- Scales, Axes, and Layout Conventions
- Interactive Visualizations
- Geographic Data Visualization
- Advanced D3 Techniques
- Styling and Polish
- Multiple Views and Dashboards
- Animation and Transitions
- Production Deployment
- Course Projects and Exercises
Chapter 1: Foundations of Data Visualization
What is Data Visualization?
Data visualization is the creation of visual representations of datasets designed to help people carry out tasks more effectively. Based on Tamara Munzner's foundational framework, data visualization
When Visualization is Useful
- Exploratory Data Analysis: When analysis problems are ill-specified and initial questions are unknown
- Long-term Tools: Developing applications for end-users in organizations to explore data over time
- Communication: Presenting known results clearly (figures for papers, articles, news reports)
- Development Support: Understanding data requirements before building statistical or machine learning models
- Debugging and Refinement: Helping developers refine and debug automated systems
- Trust Building: Helping end-users verify and build confidence in automated solutions
Core Principle: Replacing Cognition with Perception
The fundamental goal is to replace internal cognition (slow, effortful mental acts) with external perception (fast, pre-attentive visual acts). By leveraging the powerful human visual system, we can p
Inputs for Visualization: Data and Tasks
Dataset Types
- Tables: Standard row-column structure where rows are items/events and columns are attributes
- Multidimensional Tables/Data Cubes: Aggregated data over multiple dimensions
- Networks and Trees: Nodes connected by links, with trees being hierarchical networks
- Spatial Data: Geographic points (latitude/longitude) and regions (countries, states)
Attribute Types
Understanding attribute types is crucial for choosing appropriate visual encodings:
Categorical (Nominal)
- Distinctly different items with no intrinsic order
- Operations: Equality comparison only
- Examples: Country names, fruit types, car manufacturers
- Best visual channels: Hue (color), shape, spatial position
Ordered Data
Ordinal: Categories with meaningful order but non-uniform differences
- Operations: Equality and comparison
- Examples: T-shirt sizes (Small, Medium, Large), education levels
- Best visual channels: Position, luminance, size
Quantitative: Numerical values where magnitude and arithmetic are meaningful
- Operations: Equality, comparison, arithmetic
- Examples: Temperature, population, income
- Best visual channels: Position, length, area
Tasks: The "Why" of Visualization
Tasks guide visualization design choices and prevent the "combinatorial explosion" of options:
- What specific questions are you trying to answer?
- What problems are you trying to solve?
- What decisions will be informed by the visualization?
- What story do you want to tell?
- What actions should viewers be able to perform?
Exercises
Data Source Scavenger Hunt: Find three data visualizations from current news sources. For each:
- Identify the dataset type (table, network, spatial)
- Classify the attribute types used
- Determine what tasks the visualization supports
Problem Definition: Choose a dataset relevant to your field. Write a one-page description including:
- The main questions you want to answer
- Who the intended audience is
- What decisions this visualization should support
Attribute Classification Practice: Using the Iris dataset, classify each column (sepal length, sepal width, petal length, petal width, species) by attribute type and explain your reasoning.
Chapter 2: Web Technologies and Development Environment
Why Web Technologies for Data Visualization?
Web technologies offer unique advantages for data visualization:
- Universal Accessibility: Viewable by anyone with a web browser, no local software installation required
- Advanced Engineering: Modern JavaScript enables sophisticated front-end development
- Design Flexibility: Unlimited potential for custom visual designs
- Interactivity: Rich interactive features with immediate user feedback
Core Web Technologies
HTML (HyperText Markup Language)
HTML provides the structural foundation of all web pages:
Comments
That's beautiful