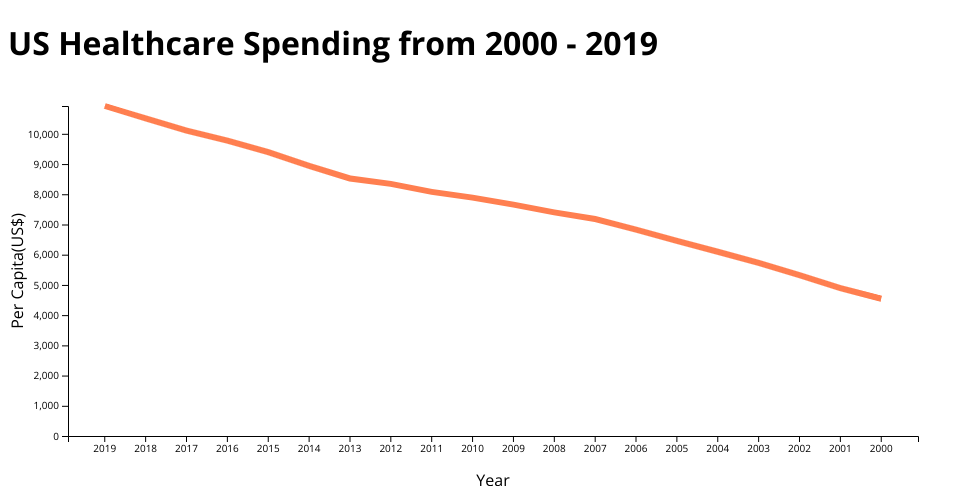
This line chart shows healthcare spending in US from 2000 to 2019 data. The data comes from (https://www.macrotrends.net/countries/USA/united-states/healthcare-spending).
MIT Licensed
This line chart shows healthcare spending in US from 2000 to 2019 data. The data comes from (https://www.macrotrends.net/countries/USA/united-states/healthcare-spending).