Resources
Contact
Pricing
🇺🇸
EN
Log in
Open Editor
Revision History
Export Image
Share
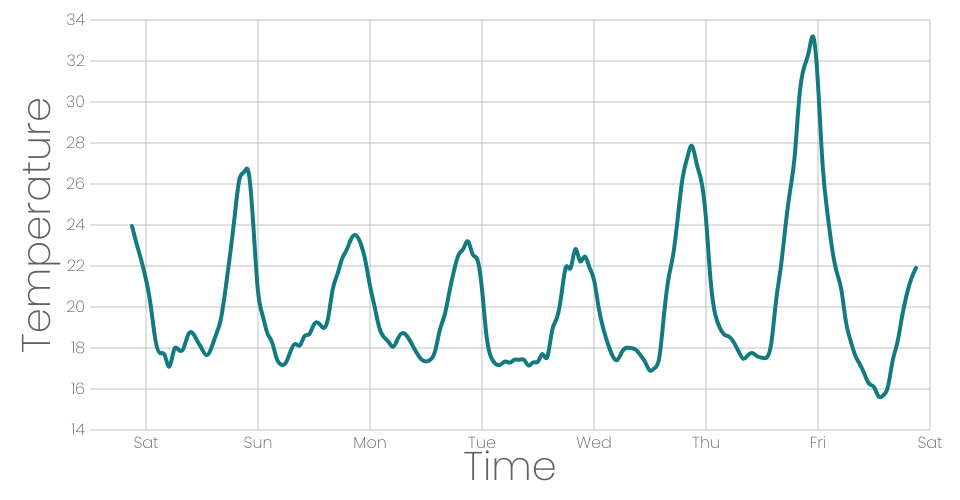
Line Chart
1
Fork
0
Likes
Carlos Caballero
0 views in last 90 days
Last edited Mar 02, 2021
Created on Mar 02, 2021
Forked from
Scatter Plot
uses
v2 runtime
use react, d3, to parse and visualize
data about sf temperatures
MIT Licensed