Resources
Contact
Pricing
🇺🇸
EN
Log in
Open Editor
Revision History
Export Image
Share
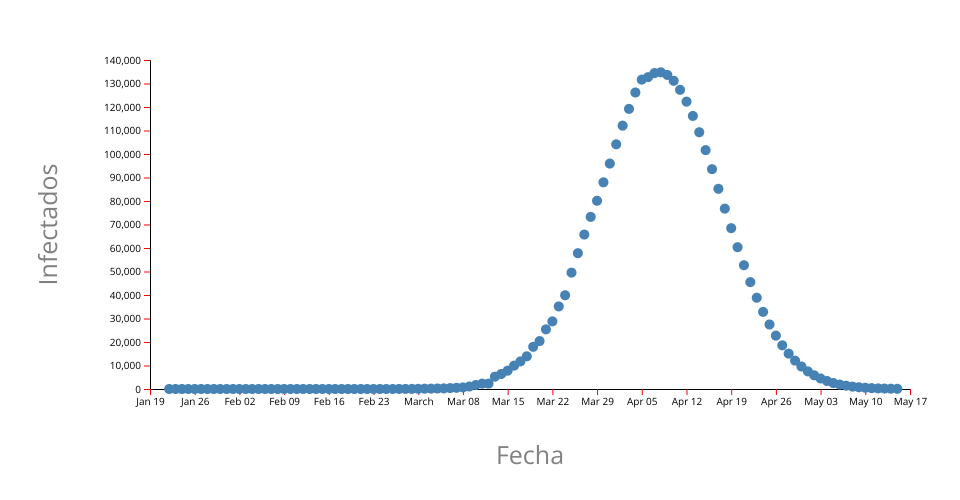
COVID-19 Forecast
1
Fork
1
Like
cacho2294
0 views in last 90 days
Last edited Apr 06, 2020
Created on Apr 06, 2020
Forked from
Stylized Line Chart
uses
v2 runtime
A scatter plot of
Data Canvas Sense Your City Dataset
.
MIT Licensed