BMW Regional Sales World Map - Interactive Dashboard
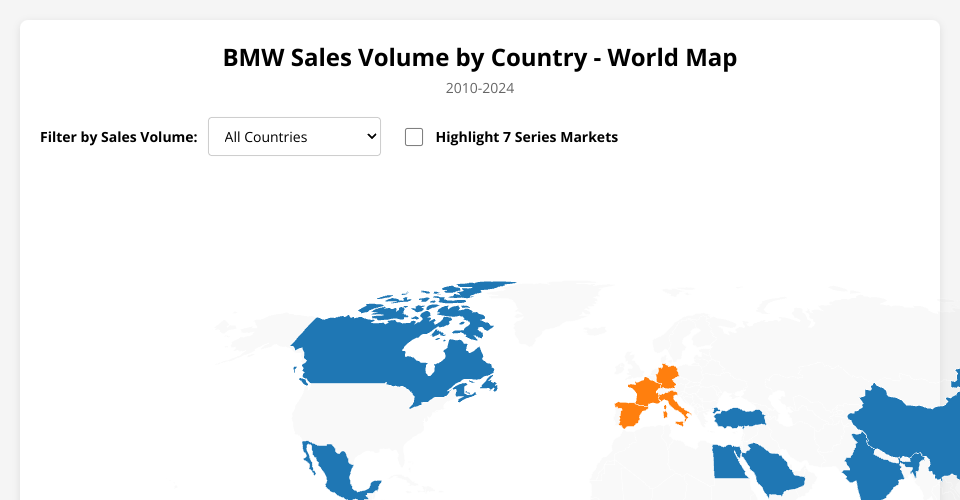
An interactive D3.js visualization showing BMW sales volumes across the world by country (2010-2024).
Features
Interactive Elements
Hover Tooltips: Hover over any country to see:
- Country name
- Total sales volume
- Top 3 selling models with volumes
- 7 Series sales percentage (highlighted in yellow)
Volume Filter Dropdown: Filter countries by sales volume:
- All Countries
- High (> 10M)
- Medium (5M - 10M)
- Low (< 5M)
7 Series Highlighter: Checkbox to highlight countries with significant 7 Series sales
- Markets are outlined in red (#ff6b6b)
- Useful for identifying key 7 Series markets
Color Coding
- Dark Blue (#1f77b4): High sales (> 10M)
- Orange (#ff7f0e): Medium sales (5M - 10M)
- Green (#2ca02c): Low sales (< 5M)
- Light Gray (#e0e0e0): No data
Data Distribution
Sales data from regional entries is distributed across representative countries:
- Asia: China, India, Japan, South Korea
- North America: USA, Canada, Mexico
- Europe: Germany, UK, France, Italy, Spain
- South America: Brazil, Argentina, Chile
- Middle East: UAE, Saudi Arabia, Turkey
- Africa: South Africa, Nigeria, Egypt
Files
index.html- HTML structure with interactive controlsscript.js- D3.js visualization and interactivity logicdata.csv- BMW sales data (2010-2024)
Usage
- Open
index.htmlin a web browser - Use the dropdown to filter by sales volume
- Check the "Highlight 7 Series Markets" checkbox to see which countries buy more 7 Series
- Hover over countries for detailed sales information
MIT Licensed