BMW Global Sales Distribution Visualization
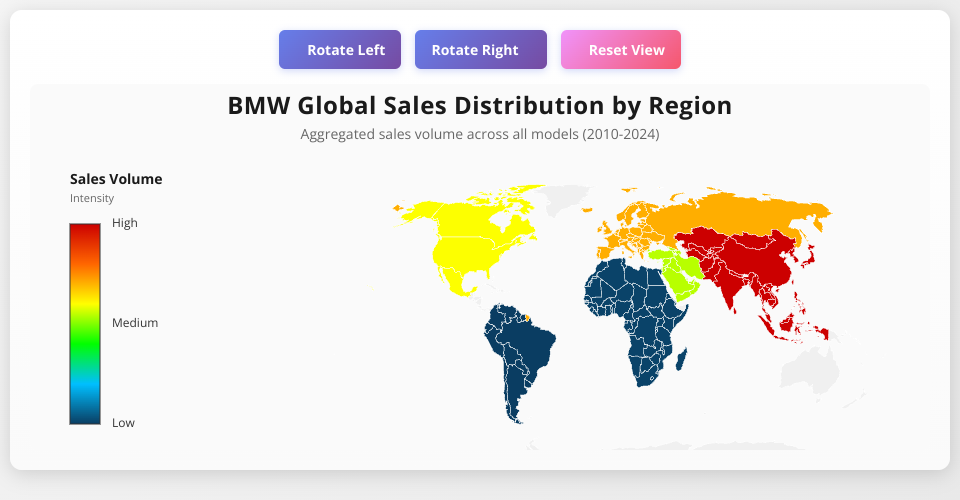
This interactive world map visualization displays BMW sales volume across different global regions from 2010 to 2024.
Key Insights
- Market Leader: Asia dominates BMW sales with significantly higher volume than other regions
- Color Encoding: A vibrant sequential color scale represents sales volume intensity, progressing from deep blue (low sales) through cyan, green, yellow, orange, to red (high sales) for maximum visual impact
- Regional Summary: The left panel provides exact sales figures for all regions, ranked from highest to lowest
- Interactive Tooltips: Hover over any country to see detailed regional information and sales data with glowing highlight effects
Features
- Responsive choropleth map using D3.js v7
- Vibrant rainbow gradient color scheme for impressive visual impact
- Dynamic hover effects with glow shadows
- Improved legend with color intensity levels
- Enhanced styling with background gradients and shadows
- Comprehensive statistical summary panel
- Interactive highlighting on hover
- Narrative caption explaining key findings
Technical Implementation
- Data Join: Uses keyed joins for efficient updates
- Color Scale: Custom interpolated gradient transitioning through blue → cyan → green → yellow → orange → red
- Projection: Natural Earth projection for balanced world view
- Performance: Tooltip throttling (50ms delay) to reduce DOM updates
- Visual Effects: Drop-shadow filters on hover for enhanced interactivity
Data Source
Sales data aggregates BMW model sales across regions including Asia, Europe, North America, South America, Middle East, and Africa.
MIT Licensed