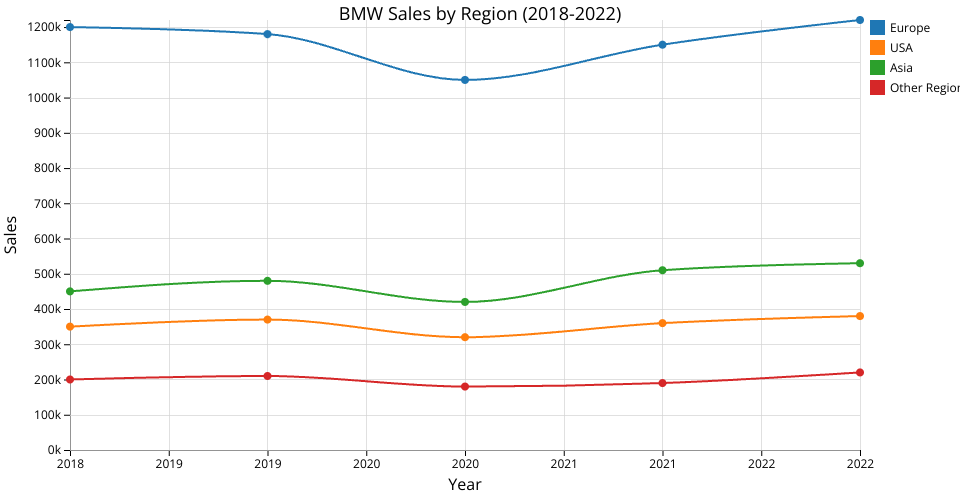
BMW Regional Sales Line Chart
This visualization displays BMW sales across different regions from 2018 to 2022 using D3.js to create a multiple line graph.
How to View
Simply open index.html in any modern web browser to see
the visualization.
Data Sources
Sales data is simulated for demonstration purposes:
- Europe: Main market for BMW
- USA: Significant market in North America
- Asia: Rapidly growing market
- Other Regions: Includes rest of the world
Implementation Details
- Uses D3.js v7 for data visualization
- Responsive line chart with grid lines
- Color-coded regions with legend
- Data points highlighted with circles
- Axes with appropriate labels and formatting
MIT Licensed