BMW Sales Analytics Dashboard
Overview
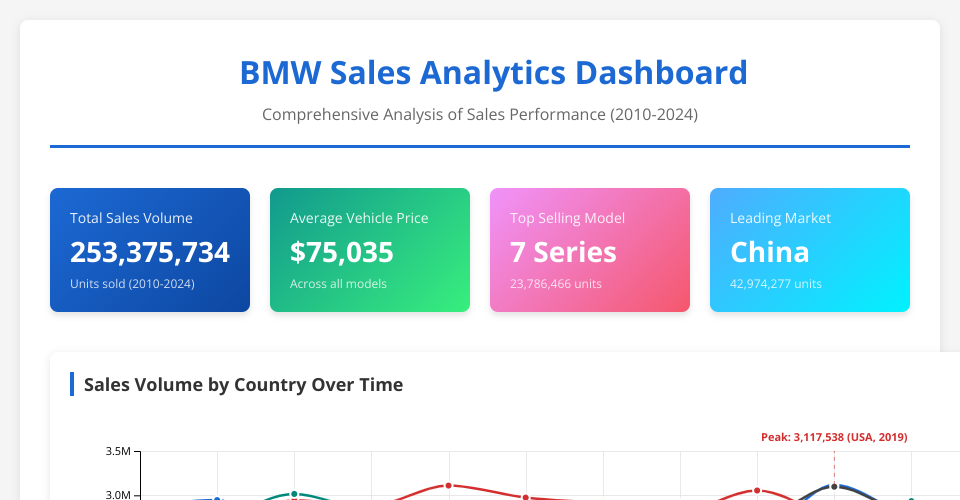
This interactive dashboard provides comprehensive analysis of BMW sales data from 2010-2024, featuring multiple visualizations and key insights.
Features
Key Metrics
- Total Sales Volume
- Average Vehicle Price
- Top Selling Model
- Leading Market
Visualizations
- Sales Volume by Country Over Time - Line chart showing trends across 6 markets
- Top 10 Best-Selling Models - Horizontal bar chart highlighting market favorites
- Regional Sales Distribution - Donut chart showing market share by country
- Sales by Fuel Type - Bar chart comparing Petrol, Diesel, Electric, and Hybrid
- Yearly Sales Trend - Area chart showing overall sales trajectory
Annotations & Highlights
- Peak sales points marked with annotations
- Best-selling model highlighted in red
- Low sales years identified
- Regional differences emphasized with color coding
Key Insights Section
- Top-selling models
- Regional performance comparison
- Peak and low sales periods
- Fuel type preferences
- Market opportunities
How to Use
- Open
index.htmlin a web browser - Hover over charts for detailed tooltips
- Review key metrics cards at the top
- Explore insights section at the bottom
Technologies
- D3.js v7
- HTML5/CSS3
- JavaScript ES6+
Data Source
BMW sales data (2010-2024) including models, regions, fuel types, and sales volumes.
MIT Licensed