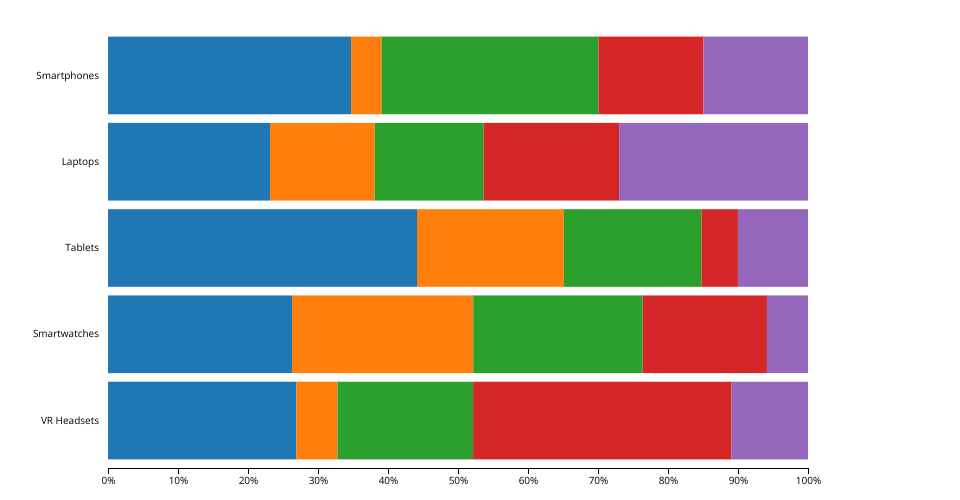
The Impact of Technology Type on User Ratings
This stacked bar chart illustrates the distribution of user ratings for various technology products. Each bar represents a different technology, such as Smartphones, Laptops, Tablets, Smartwatches, and VR Headsets, segmented by ratings that range from "below 5.0" to "above 8.5". The purpose of this visualization is to demonstrate how different types of technology fare in terms of user satisfaction and performance, providing a comprehensive view of how each category is perceived across diverse rating levels. The total percentage for each technology type sums to 1, signifying 100%, allowing for an accurate comparison of rating distributions. When users hover over each segment of the bars, they will see a tooltip displaying the exact percentage of each rating level within that technology category, enabling a deeper understanding of consumer ratings in the tech industry.