Analyzing the Impact of COVID-19 on Global Population Dynamics
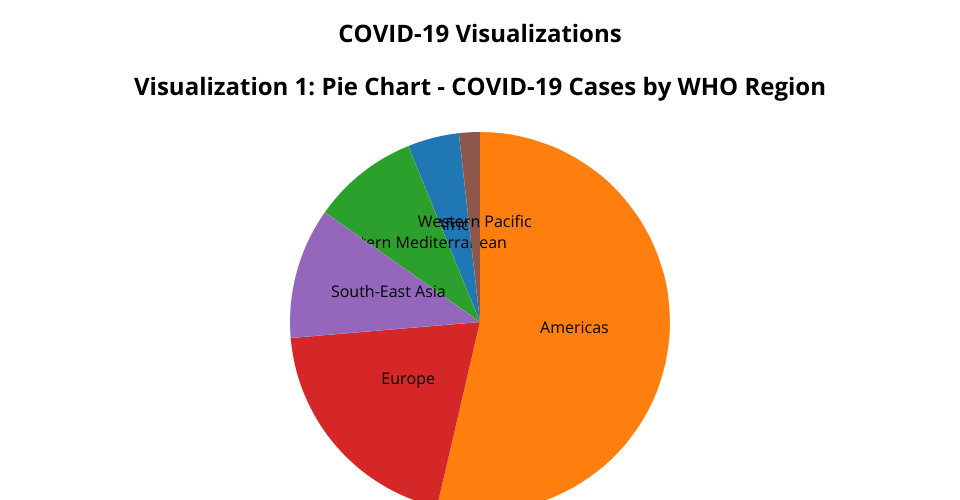
- Initial Visualization Using D3.js Pie Chart of COVID-19 Cases by WHO Region(pre-cleaning).
- Stacked Bar Chart of COVID-19 cases by Country-Using D3.js.
MIT Licensed
Analyzing the Impact of COVID-19 on Global Population Dynamics