Resources
Contact
Pricing
🇺🇸
EN
Log in
Open Editor
Revision History
Export Image
Share
Area chart - Romanian GDP
0
Forks
0
Likes
beauMarko
0 views in last 90 days
Last edited Jan 14, 2021
Created on Jan 14, 2021
Forked from
Customizing axes
uses
v2 runtime
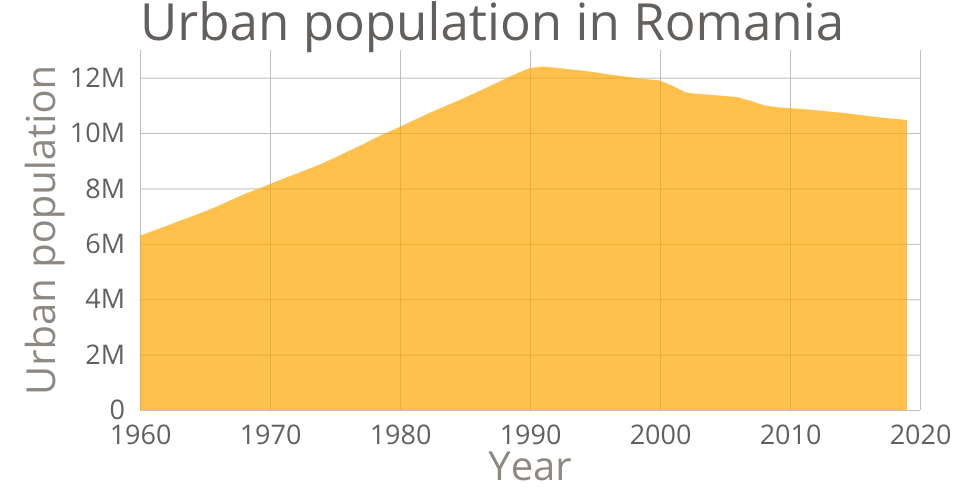
This area chart represents the evolution of urban population in Romania. Source:
WorldBank
.
MIT Licensed