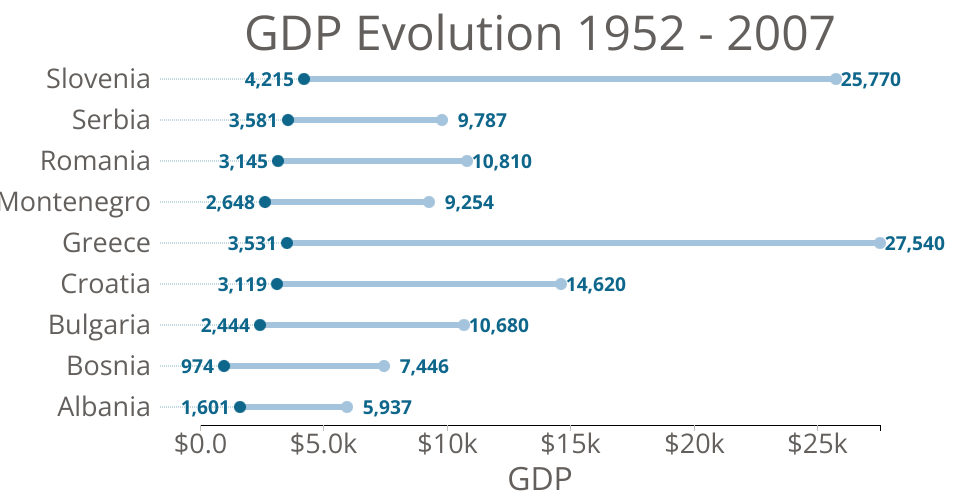
This dumbbell chart illustrates the evolution of GDP per capita for the Balkans countries over a period of 55 years (1952 and 2007). Source: Gapminder data.
MIT Licensed
This dumbbell chart illustrates the evolution of GDP per capita for the Balkans countries over a period of 55 years (1952 and 2007). Source: Gapminder data.