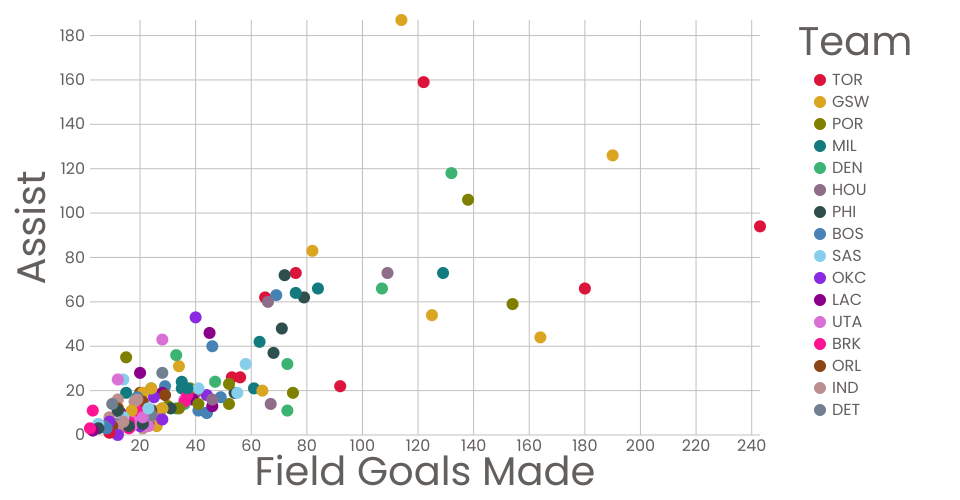
A scatter plot of The NBA Playoffs data in 2018-2019.
- The scatter plot shows the Field Goals Made vs. Assist, each dot represents for one player, and the different colors are assigned as their team.
- Apparantly there is a super goal-maker in TOR, and an awesome teammate in assisting in GSW.
MIT Licensed