Bar Chart Visualization
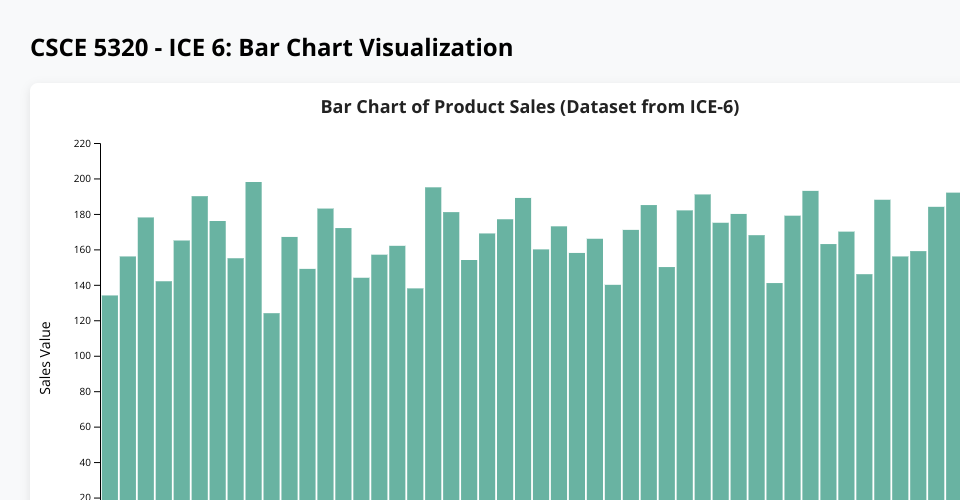
This project creates an interactive bar chart visualization using D3.js that displays product sales data from the provided CSV file.
Features
- Interactive bar chart with 49 products (Product A through Product AW)
- Hover effects that change bar color to orange (#ff9933)
- Tooltips showing product name and value on hover
- Rotated X-axis labels for better readability
- Clean, modern design with shadow effects
- Responsive scaling
Data Summary
The visualization displays sales values ranging from 124 to 198 across 49 products:
- Lowest value: Product J (124)
- Highest value: Product I (198)
How to Run
- Ensure
data.csvandindex.htmlare in the same folder - Open
index.htmlin a web browser - Note: You may need to run a local server to load the CSV file properly
Technologies Used
- D3.js v7
- HTML5
- CSS3
MIT Licensed