Reusable Scatter Plot - Car Dataset
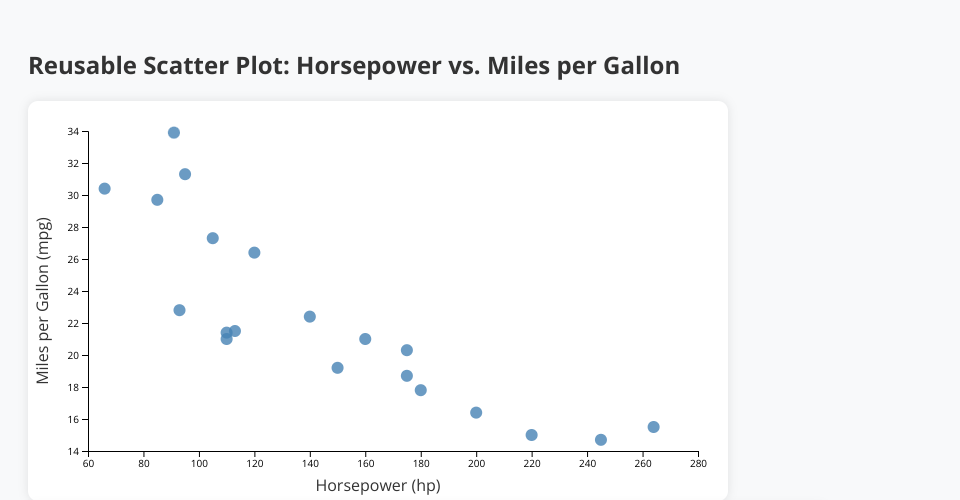
This project demonstrates a reusable D3.js scatter plot visualization using modular JavaScript architecture.
Features
- Reusable Chart Component: Modular scatter plot function with configurable parameters
- Auto-Rotation: Automatically switches between different axis configurations every 2 seconds
- Clean Architecture: Separated concerns with dedicated modules for data processing, chart rendering, and control logic
File Structure
index.html- Main HTML fileindex.js- Application entry pointscatterPlot.js- Reusable scatter plot componentchartController.js- Chart rendering and rotation logicdataProcessor.js- CSV data loading and processingdata.csv- Car dataset (horsepower and MPG)
Usage
Run a local server in the project directory:
MIT Licensed